🌍 Public
Logan Airport Weather vs Delay
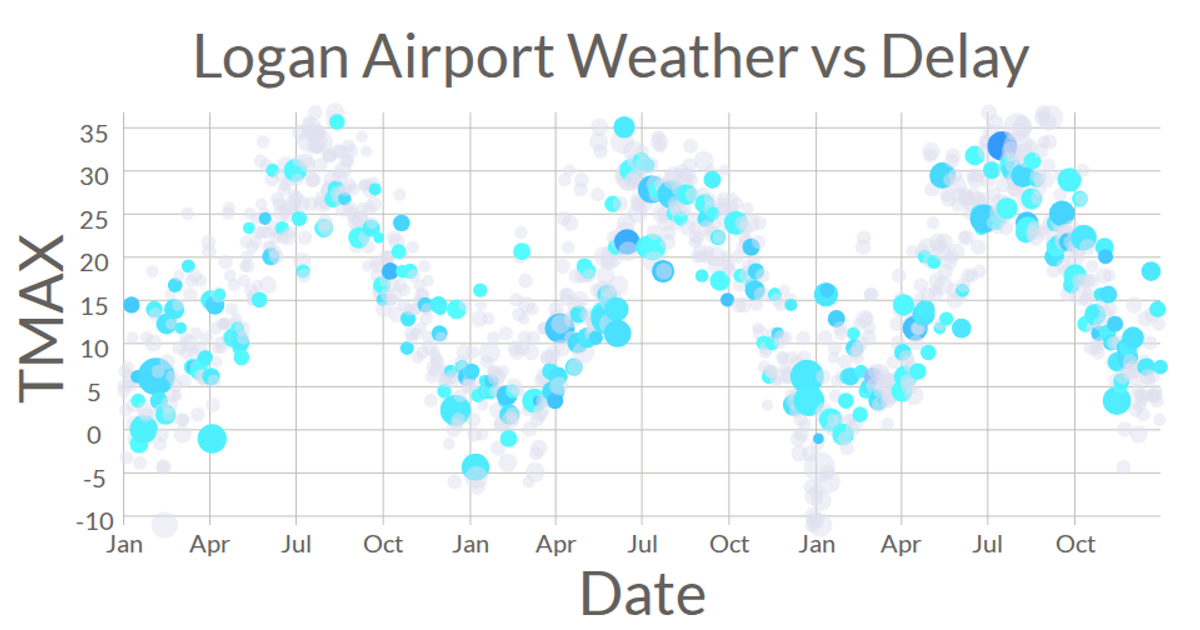
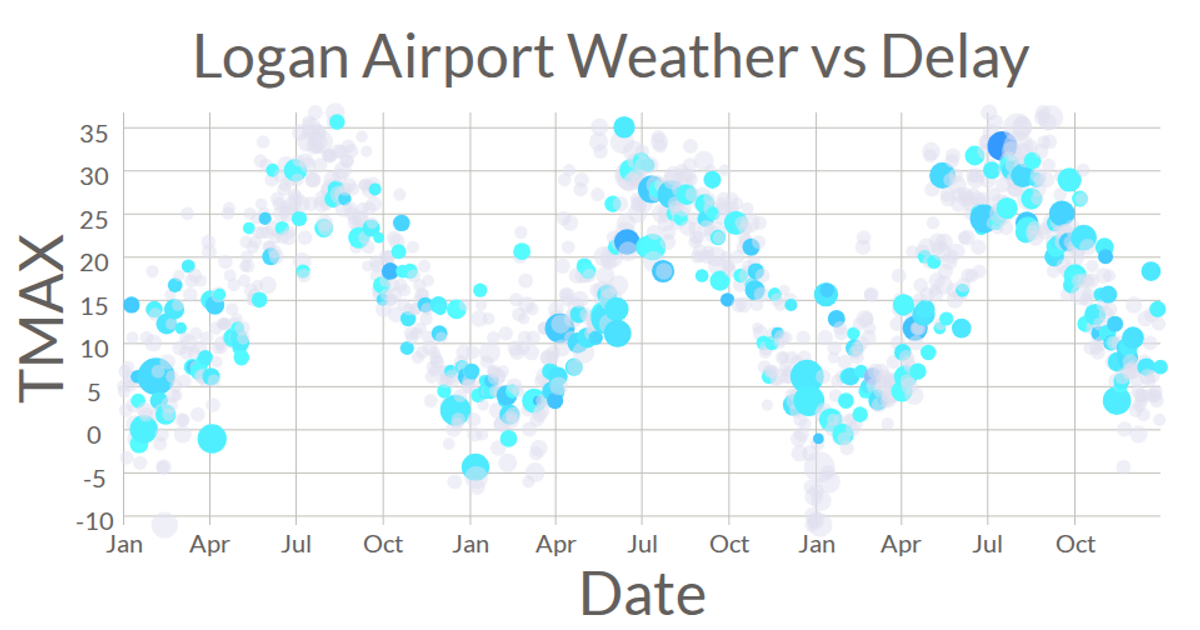
A linked visualization explores daily weather conditions and flight delays at Logan Airport in 2016. A scatter plot maps wind speed against date, with circle size encoding departure delay and color indicating precipitation. A radial ring chart displays the same delay data as arcs, colored red for adverse weather or blue for normal conditions, with month labels positioned along the ring. Hovering over a scatter plot point highlights the corresponding arc in the ring chart, using D3 v5 with SVG rendering and data from a CSV file.
AI-generated descriptionLogan Airport Weather vs Delay. Added ring chart with d3.arc Added color representing bad weather Added interaction Added axis Added connected view
MIT Licensed




Comments
Sign in to join the discussion.