🌍 Public
Timeline Chart
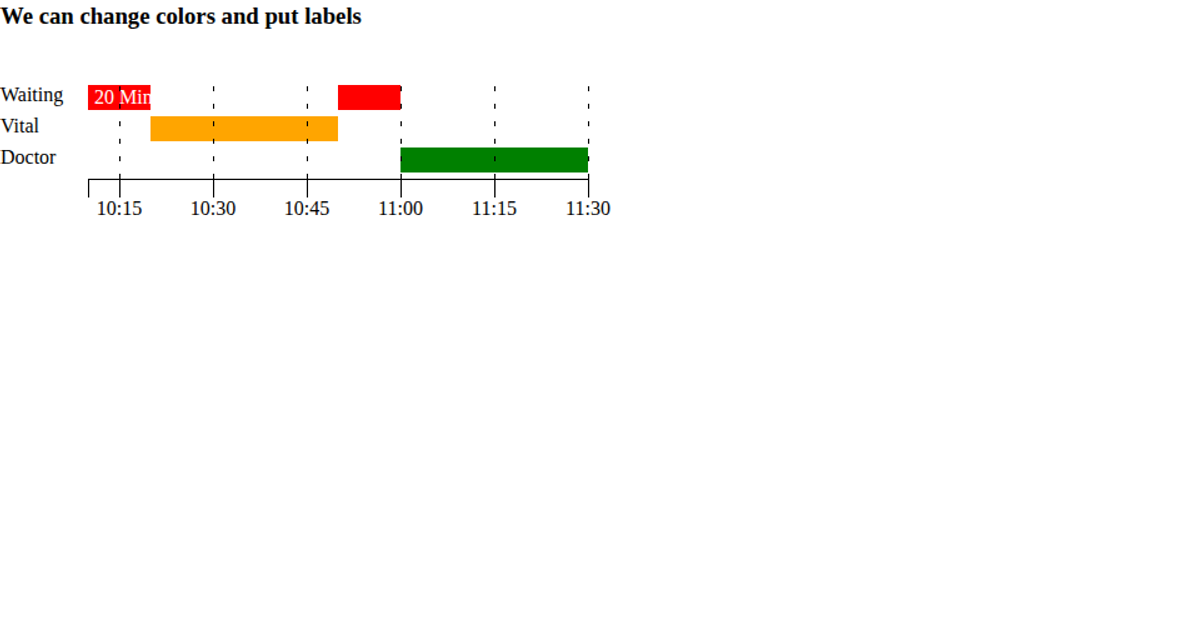
This timeline chart visualizes device activity intervals, showing periods labeled as "running" or "stoppage" across multiple test devices. Rendered as SVG rectangles with D3 v5 scales (scaleTime, scaleBand, scaleOrdinal) and React components, each bar spans its start and end dates on a time axis. Hovering reveals tooltips with the formatted time range. The color scale distinguishes the two activity categories, while axis components handle tick labels and gridlines. The data originates from a static array of device states.
AI-generated descriptionTimeline chart using react and D3 js.
MIT Licensed




Comments
Sign in to join the discussion.