🌍 Public
Untitled
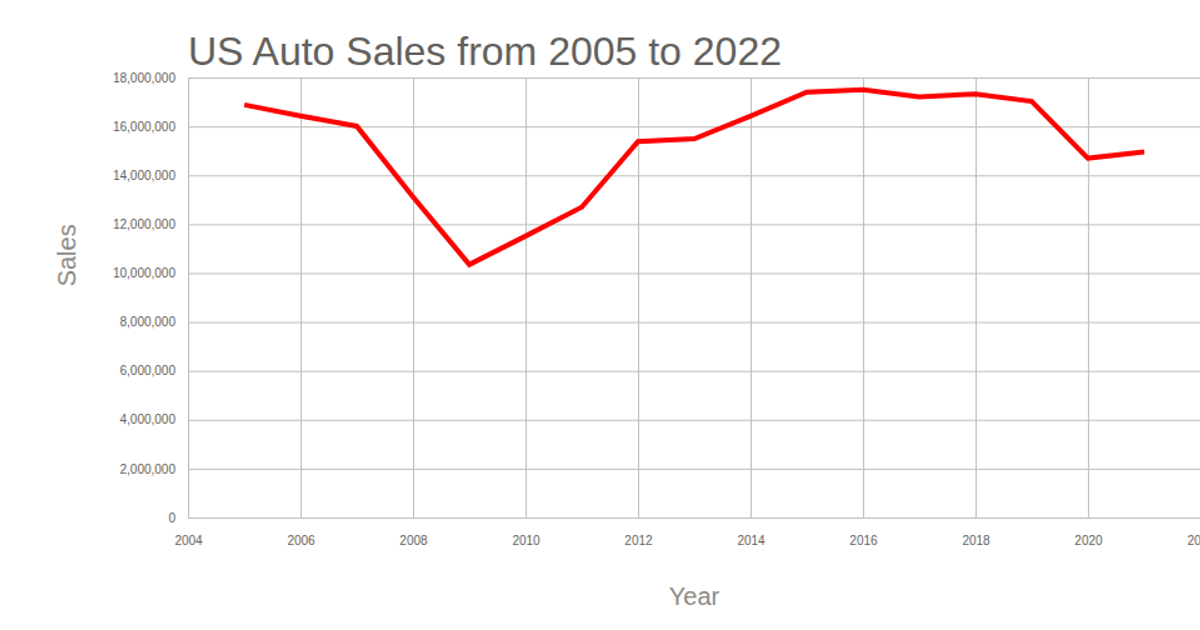
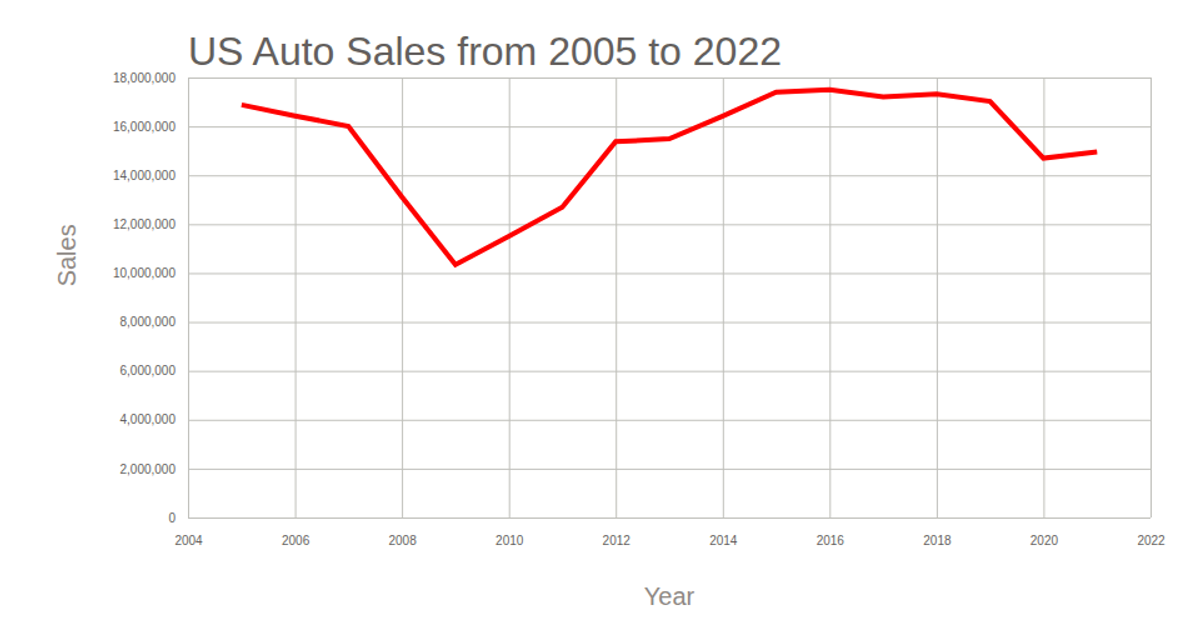
A line chart displays annual total automotive sales in the United States, with the year on the x-axis and sales on the y-axis, titled "各種能源日用量比較." The visualization uses D3.js and C3.js, loading data from a CSV file via `d3.csv` and rendering the chart as an SVG. The axes are labeled "Year" and "Sales," with the sales line drawn in red. The D3 `scaleTime`, `scaleLinear`, and `line` generator construct the plot, while gridlines and tick marks are styled via CSS.
AI-generated descriptionMIT Licensed




Comments
Sign in to join the discussion.