🌍 Public
A10 White Hat Visualization
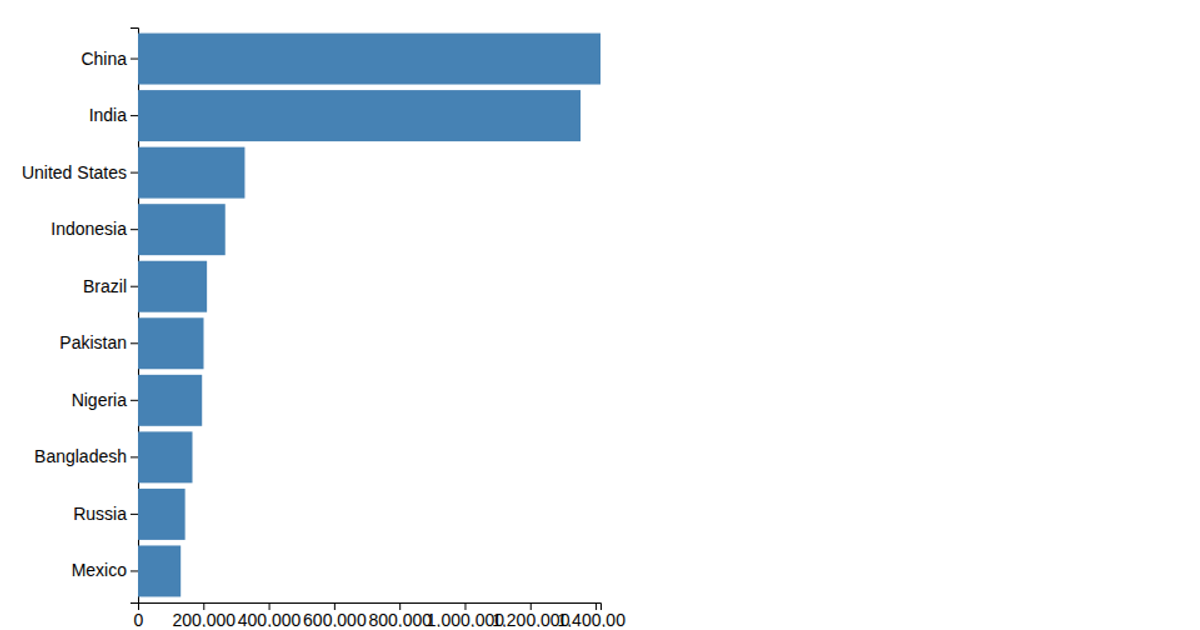
This visualization displays a bar chart comparing average female height across six countries, with each bar representing a country and its corresponding height value in inches. The chart uses D3 v7 to create an SVG rendering, employing `d3.scaleBand` for the categorical x-axis and `d3.scaleLinear` for the numeric y-axis. Bars are drawn as SVG rectangles, with value labels positioned above each bar. Axes are generated using `d3.axisBottom` and `d3.axisLeft`, with the y-axis formatted to show inch markers. The chart includes a title and axis labels for clarity.
AI-generated descriptionMIT Licensed



Comments
Sign in to join the discussion.