Customizing Axes
This bar chart displays the Gini index for the top five most income-inequal countries, with country names on the y-axis and the Gini value on the x-axis. The chart uses D3 v5 APIs including `scaleLinear`, `scaleBand`, `axisLeft`, and `axisBottom` to render the SVG, while custom tick formatting converts values to abbreviated forms. Axes are styled with removed domain lines, colored ticks, and custom labels for the title and axis. Data comes from the CIA World Factbook, loaded via `d3.csv`.
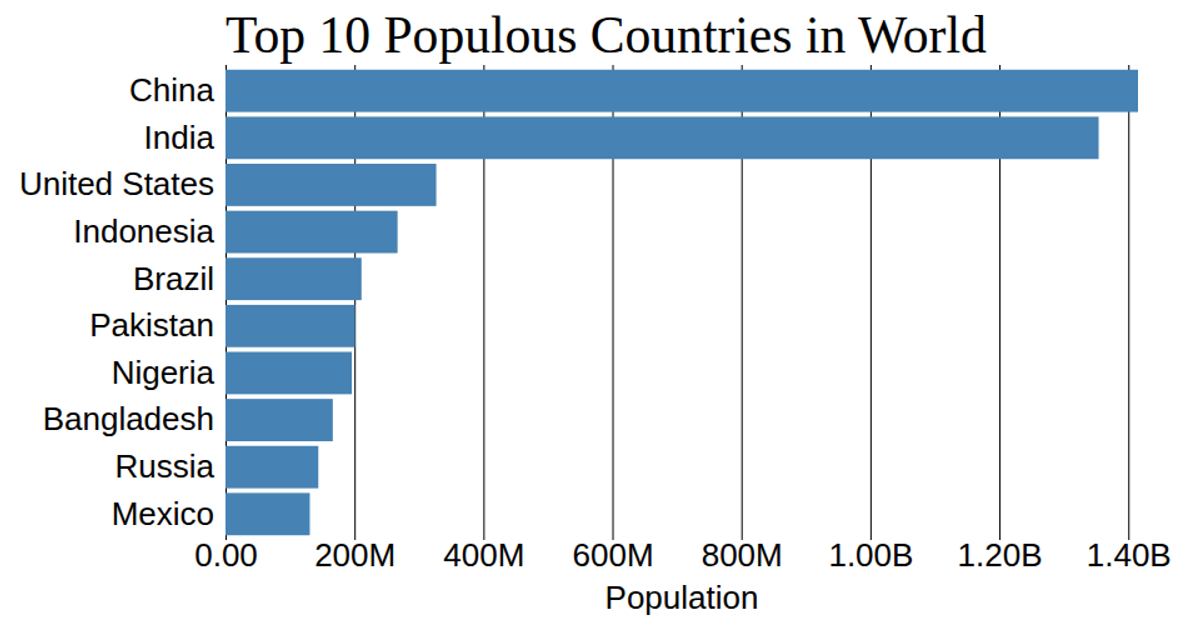
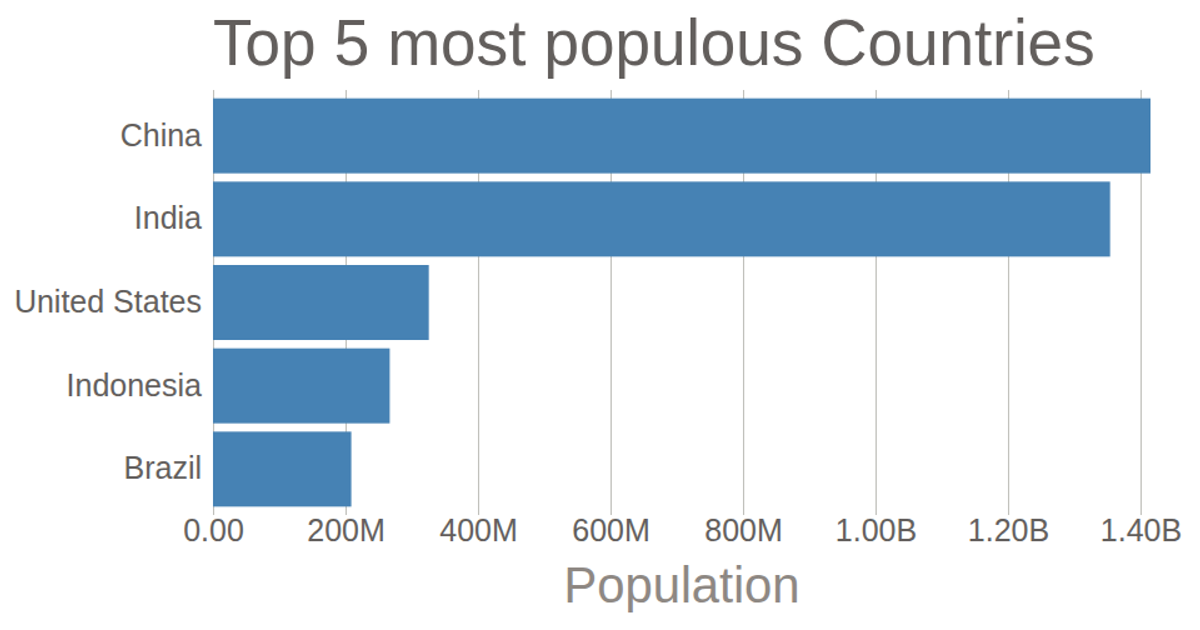
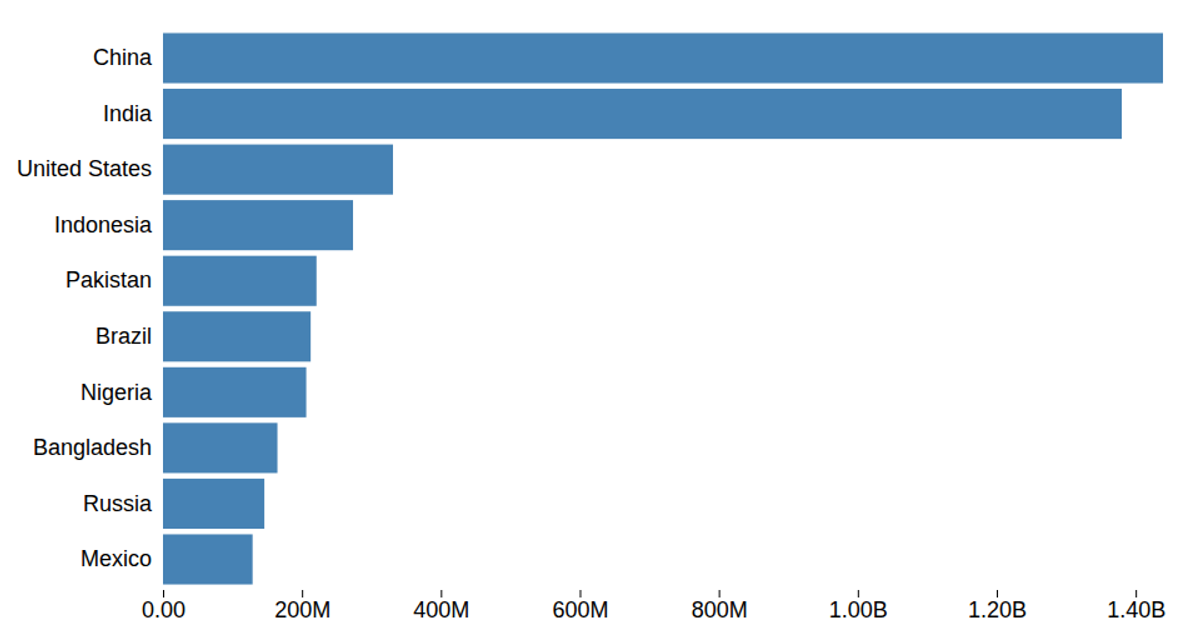
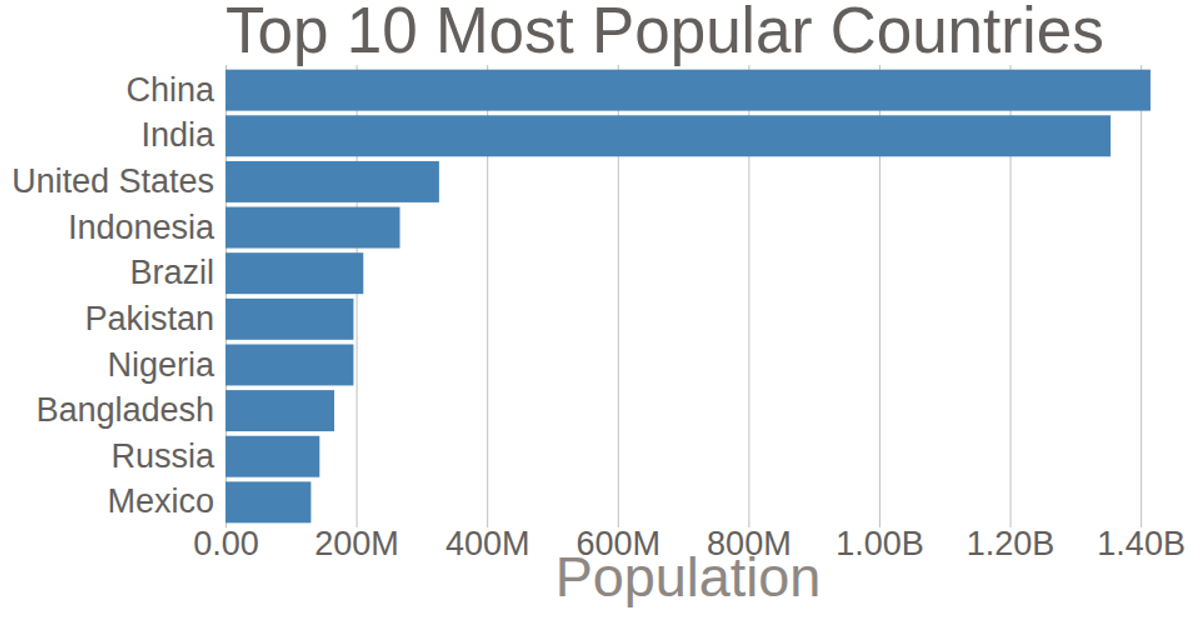
AI-generated descriptionThis bar chart shows population of the top 10 most populous countries. The data comes from the year 2018 estimate in United Nations: World Population Prospects 2017. It also demonstrates customization of D3 axes.
See also the first bar chart visualization that this one builds on: Making a Bar Chart.



Comments
Sign in to join the discussion.