🌍 Public
Fork of Choropleth Map
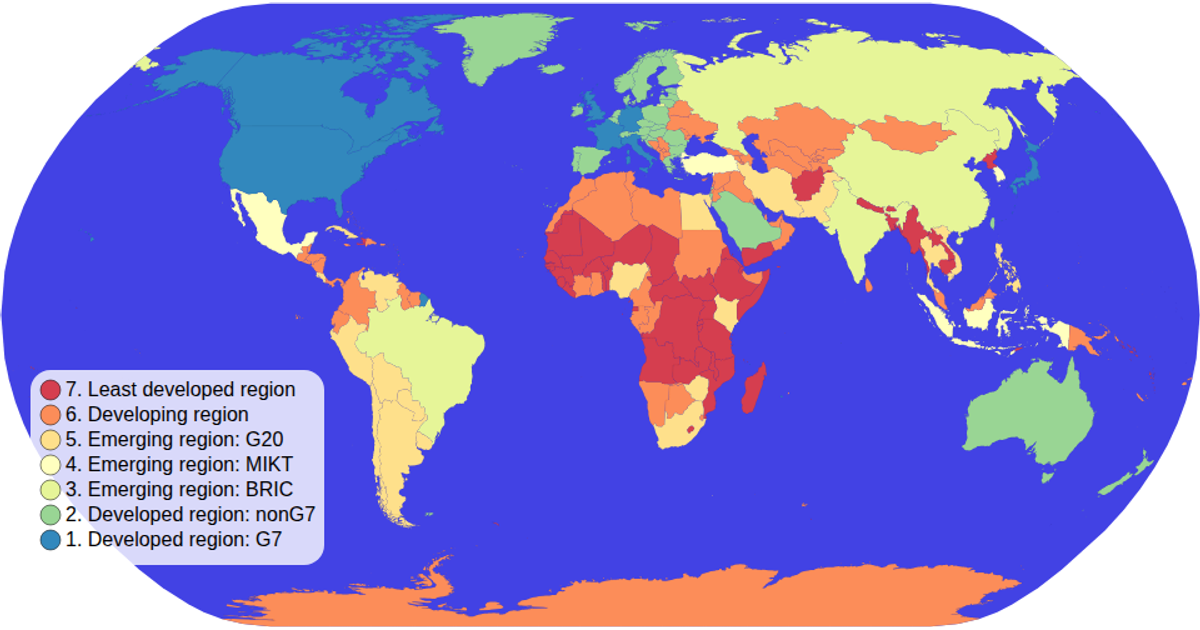
This map visualizes global economic classifications by shading each country with a categorical color scale, with a legends showing the income groups. It uses d3.geoNaturalEarth1 and d3.geoPath to project and draw country boundaries from TopoJSON data sourced from world-atlas, while d3.scaleOrdinal maps economy categories to a spectral color scheme. The map supports zooming via d3.zoom, and hovering highlights individual countries. A custom colorLegend module builds the SVG legend with circles and text labels.
AI-generated descriptionMIT Licensed




Comments
Sign in to join the discussion.