🌍 Public
D3 v5 Zoomable Sunburst
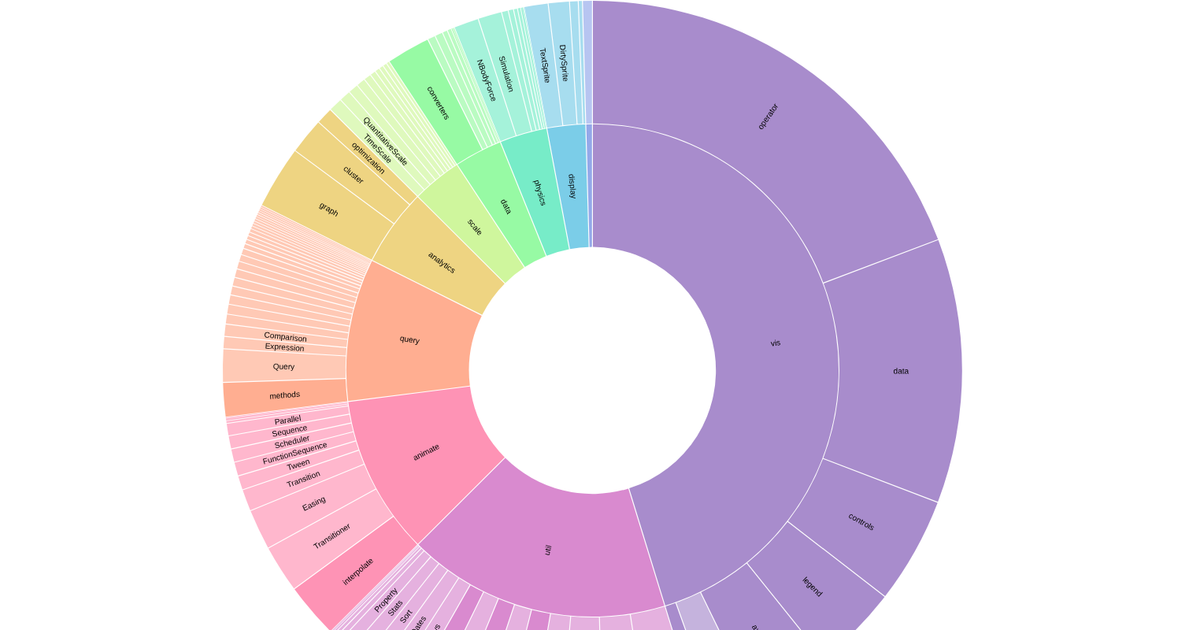
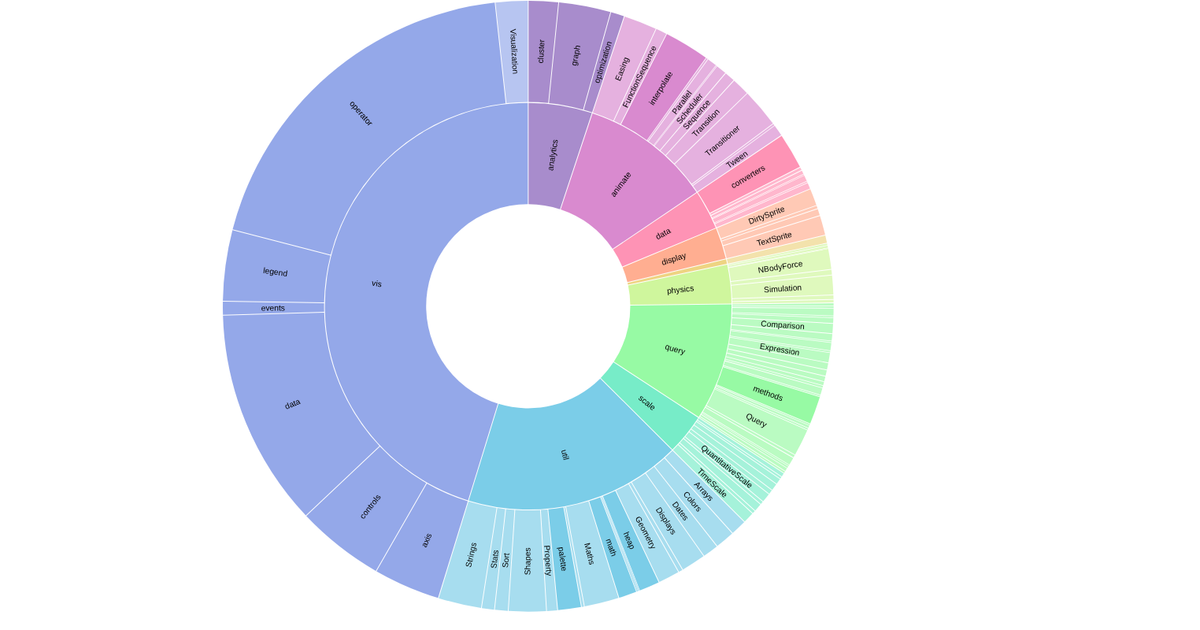
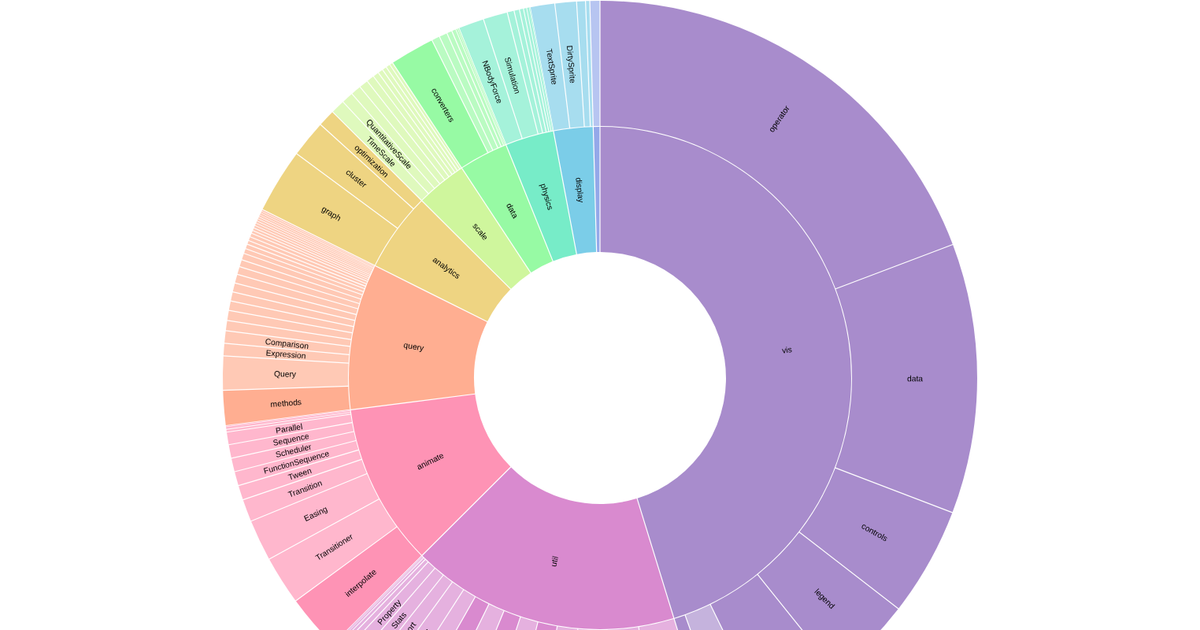
This interactive visualization displays a hierarchical sunburst chart of the ISO 37120 city indicator dataset, showing nested categories as colored arcs that users can click to zoom into deeper levels. Built with D3 v5, it uses `d3.partition` to compute the radial layout and `d3.arc` for path generation, with smooth 750ms transitions handled by `transition.attrTween` and `d3.interpolate`. The color palette is generated via `d3.scaleOrdinal` with `d3.interpolateRainbow`, and labels are rotated and positioned using `labelTransform`. Data is loaded remotely from the Observable `@observablehq/flare` library.
AI-generated descriptionMike Bostock's D3 Zoomable Sunburst example
- with D3 v5 (based on the changes in v5) <br></br> Ported from this Observable notebook for this forum thread. Many thanks to Bryan Gingechen who answered my question about the necessary steps to get from an (Observable) JavaScript notebook to a vanilla JavaScript index.html. He presented his solution on blockbuilder.org
MIT Licensed




Comments
Sign in to join the discussion.