🌍 Public
activity-7.1-q5
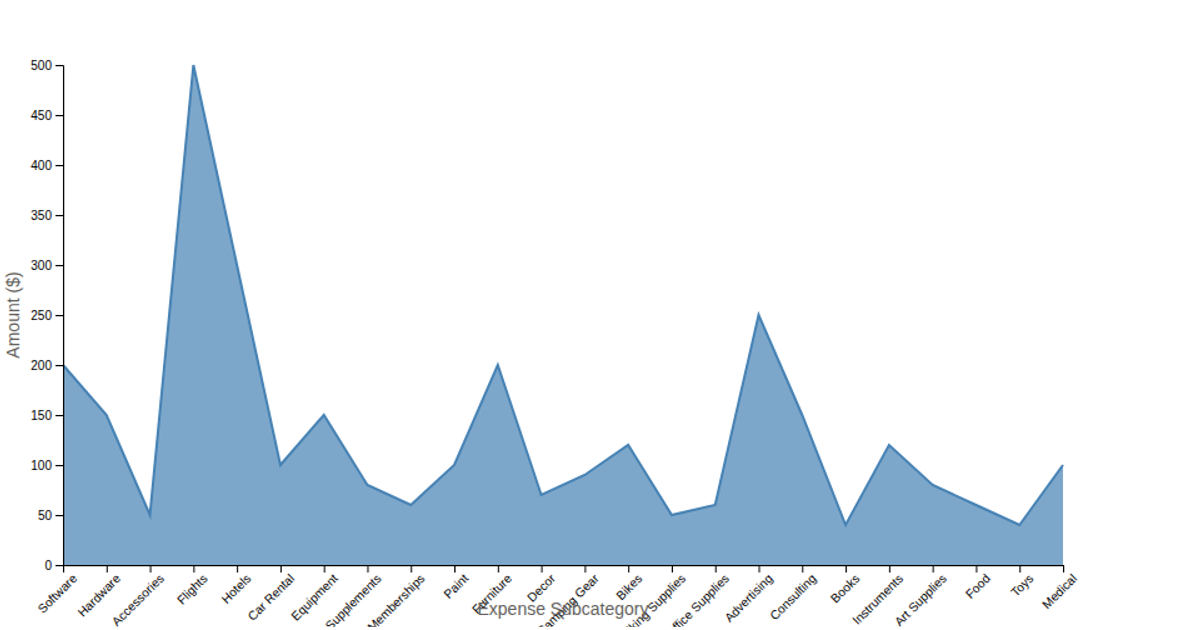
This visualization shows the average applicant income across three property area categories: Rural, Semiurban, and Urban. The chart uses a filled area path rendered with D3's `d3.area()` generator, with an x-axis scale band and linear y-axis scale. Data is loaded asynchronously from a GitHub Gist CSV file and aggregated using `d3.rollups` with `d3.mean` to compute average incomes per group. The SVG output includes labeled axes for property area and income values.
AI-generated descriptionAn example showing the capabilities of VizHub:
- Loads D3 via UNPKG.
- Demonstrates use of
importfrom"d3". - Demonstrates use of
importfrom local ES6 modules.
MIT Licensed





Comments
Sign in to join the discussion.