🌍 Public
Lets make a MAP with d3 :)
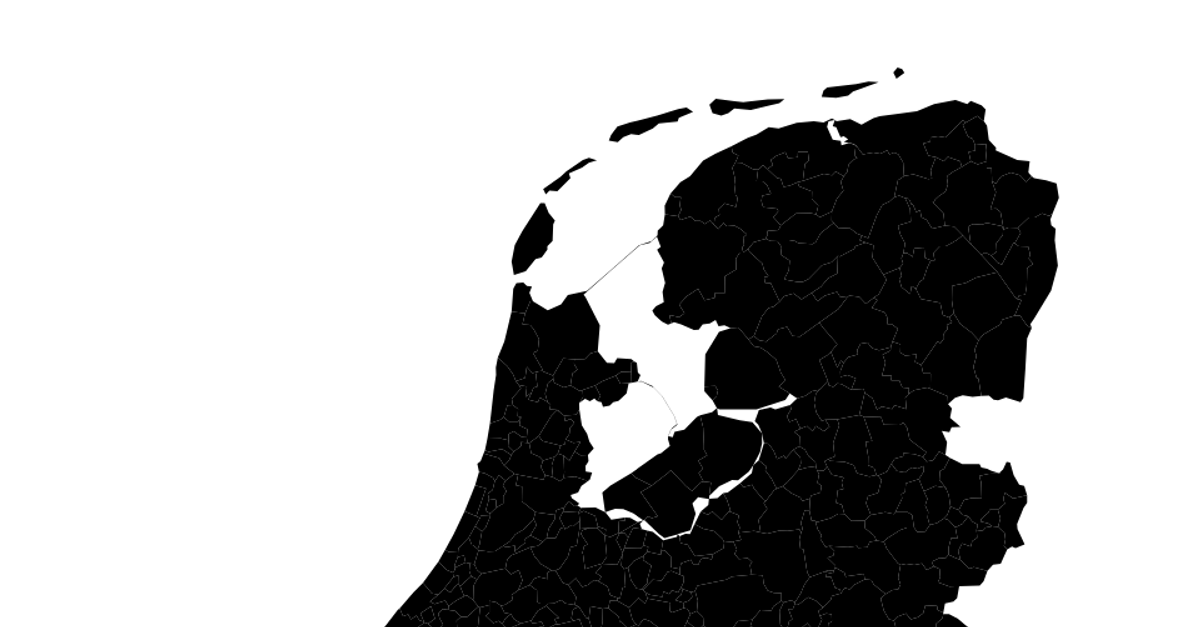
This interactive map displays the municipalities of the Netherlands, rendered as green SVG paths with orange borders atop a pink sphere. It uses the d3.geoPath and d3.geoMercator APIs to project TopoJSON data from cartomap.github.io. A red circle is also placed using a projection call, though its data binding appears incomplete. The visualization incorporates d3.zoom to enable pan and zoom interactions, which apply a transform to the map group.
AI-generated descriptionMIT Licensed




Comments
Sign in to join the discussion.