🌍 Public
Fork of Multiple Views with Brushing
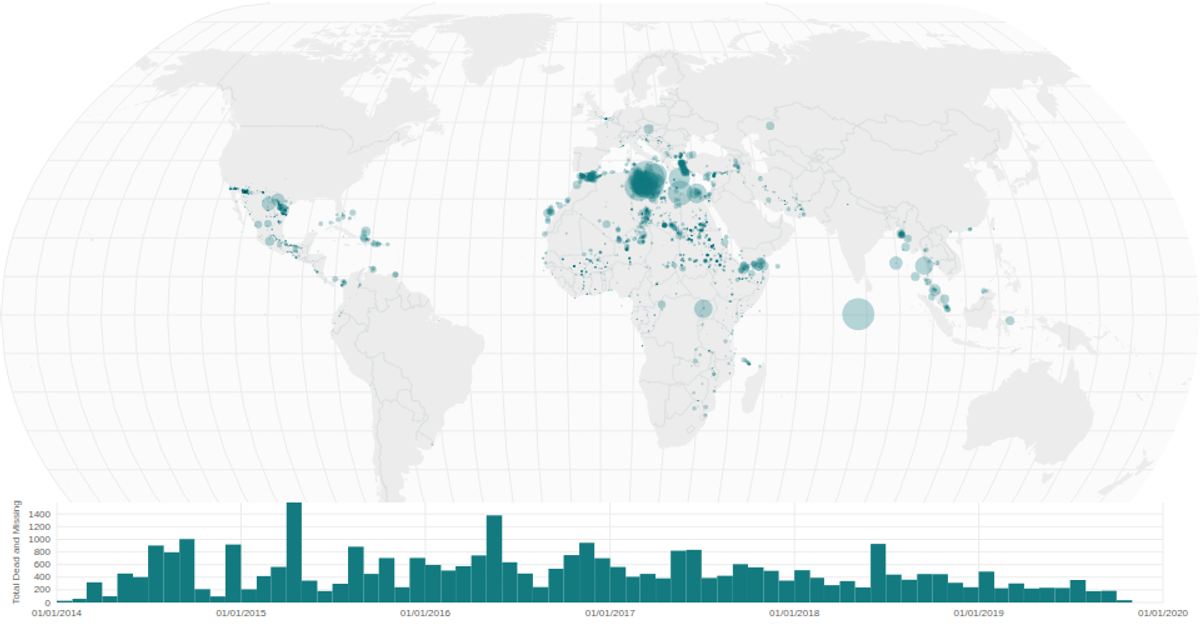
This interactive visualization combines a world map with a time-series histogram to explore data on missing migrants. The map uses a square-root size scale to encode the "Total Dead and Missing" count for each location, with circles overlaid on a natural Earth projection rendered using d3.geoPath. A brushing interaction on the histogram below filters the map’s data points by date range. The visualization is built with React, using d3.scaleSqrt, d3.scaleTime, and d3.brushX, with city coordinates from the Simplemaps World Cities Database.
AI-generated descriptionA world map showing cities with population greater than 50,000. City data from Simplemaps: World Cities Database.
Country boundaries from World Atlas TopoJSON, polished for visual style, including graticules.
MIT Licensed


Comments
Sign in to join the discussion.