🌍 Public
Activity_6-Task_4
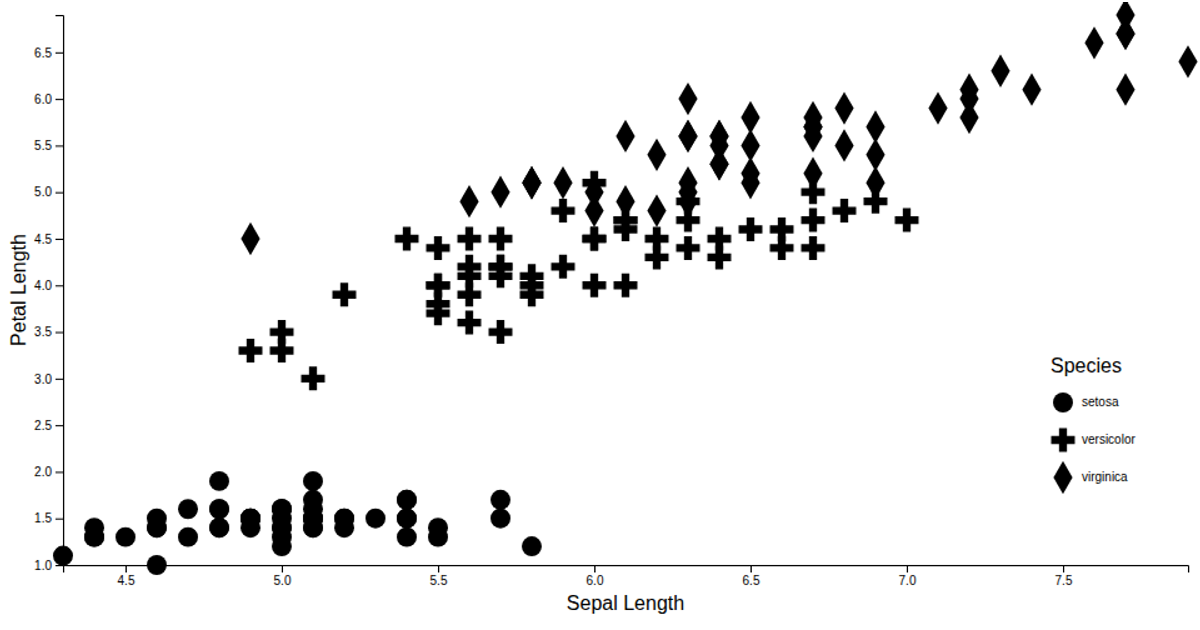
This example displays the average sepal length for each iris species in the classic Iris dataset, presenting the computed summary as a formatted JSON list in a `<pre>` element. The visualization first loads and parses `data.csv`, then uses the `flatRollup` API with a custom `sum` aggregation to group records by species and calculate the mean. It relies on D3 v7's `select`, `csvParse`, and `flatRollup` functions to transform the raw measurements into a concise textual summary.
AI-generated descriptionMIT Licensed




Comments
Sign in to join the discussion.