🌍 Public
Fork of Fork of Fork of Nadieh viz
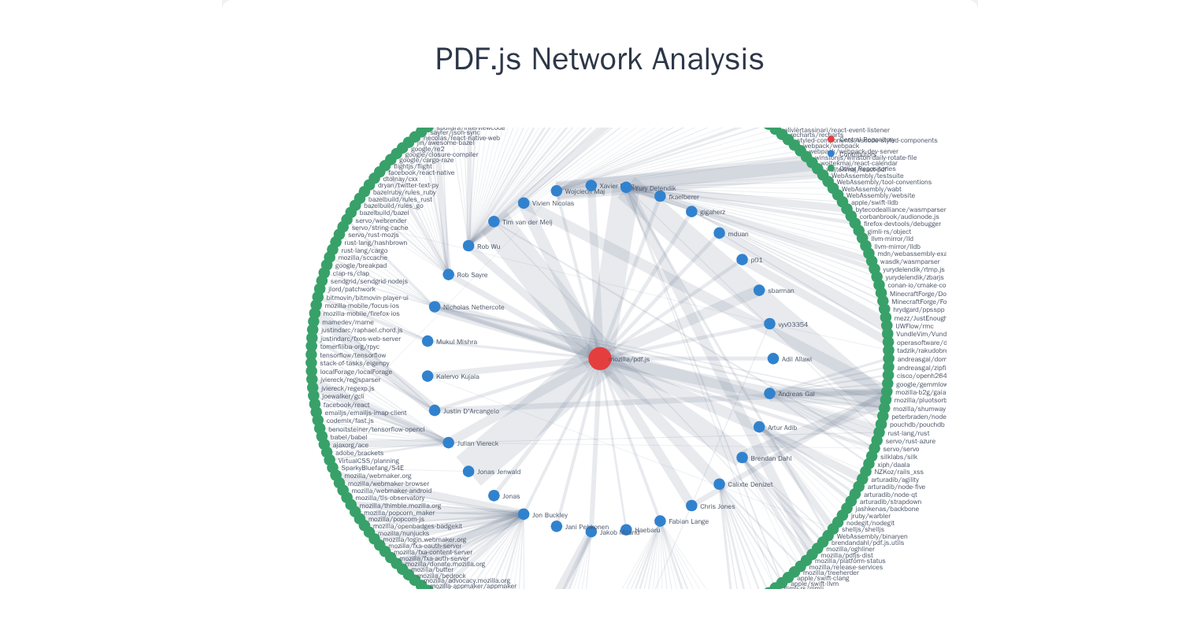
This interactive dashboard analyzes commit data from the PDF.js project, presenting a network graph of author collaborations and repository contributions. The visualization uses d3.forceSimulation to position nodes, with force-directed layout and drag functionality, while a central node connects contributors to various repositories. Additional views include horizontal bar charts showing commit counts per author and per repository, both featuring d3.zoom for interactive scaling. The dashboard incorporates tooltips on hover and visual encoding through graduated color scales, revealing patterns in contributor activity and project repository relationships.
AI-generated descriptionMIT Licensed




Comments
Sign in to join the discussion.