🌍 Public
D3 Starter - one node one line
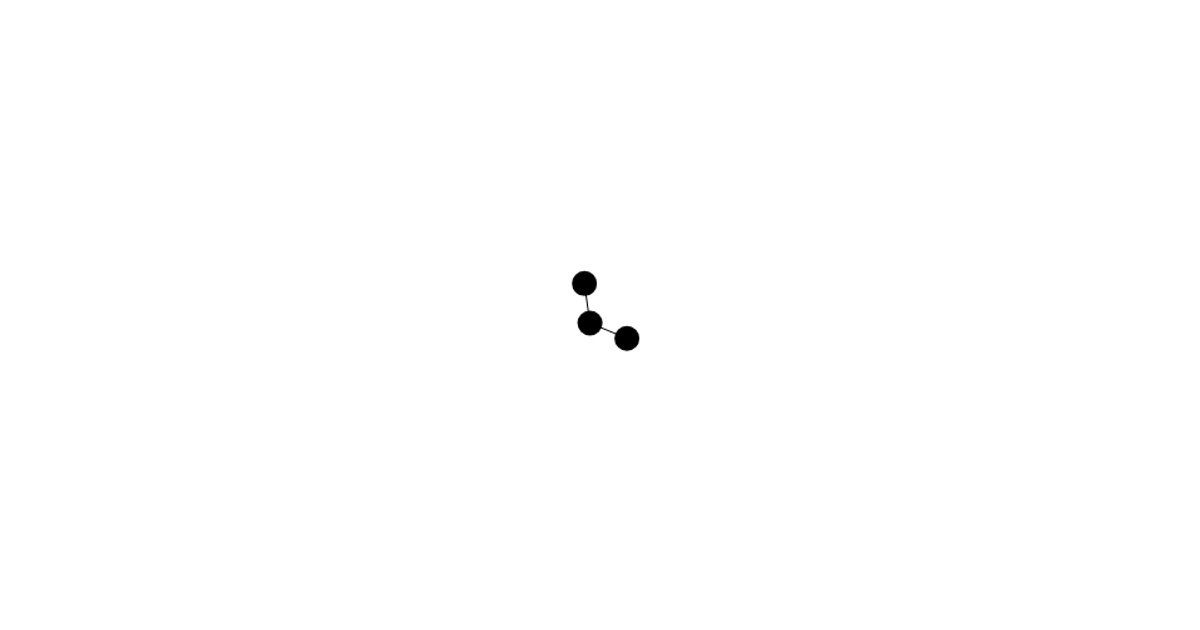
This example displays a small directed network of transcription factor genes and their regulatory interactions, rendered as nodes and lines. It uses the `d3.forceSimulation` API to position the ten nodes based on the link data from `tf.json`, and the `d3.select` method to append the SVG elements. The visualization highlights the connectivity patterns among the ENSG identifiers, with a visible self-loop on one node.
AI-generated descriptionMIT Licensed


Comments
Sign in to join the discussion.