🌍 Public
Cali map
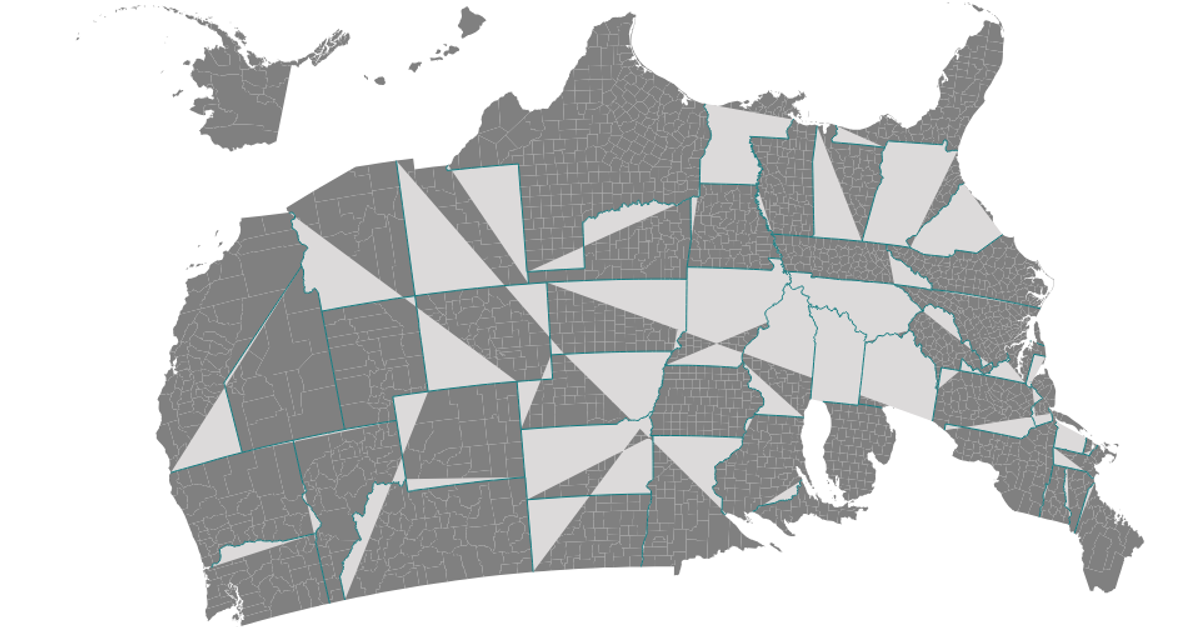
This map of California counties uses a Mercator projection from d3-geo to render land area and interior borders. The visualization displays county boundaries derived from a TopoJSON dataset of California, with the d3.geoPath and d3.geoMercator APIs converting geographic coordinates into SVG paths. React manages the component structure while d3.json and topojson's feature and mesh functions process the raw data, filling land masses in teal and stroke interiors in a lighter contrasting color.
AI-generated descriptionA Scatter Plot of the Data Canvas Sesnse Your City Dataset
MIT Licensed




Comments
Sign in to join the discussion.