🌍 Public
Suicide vs Age Statistics in 30 years
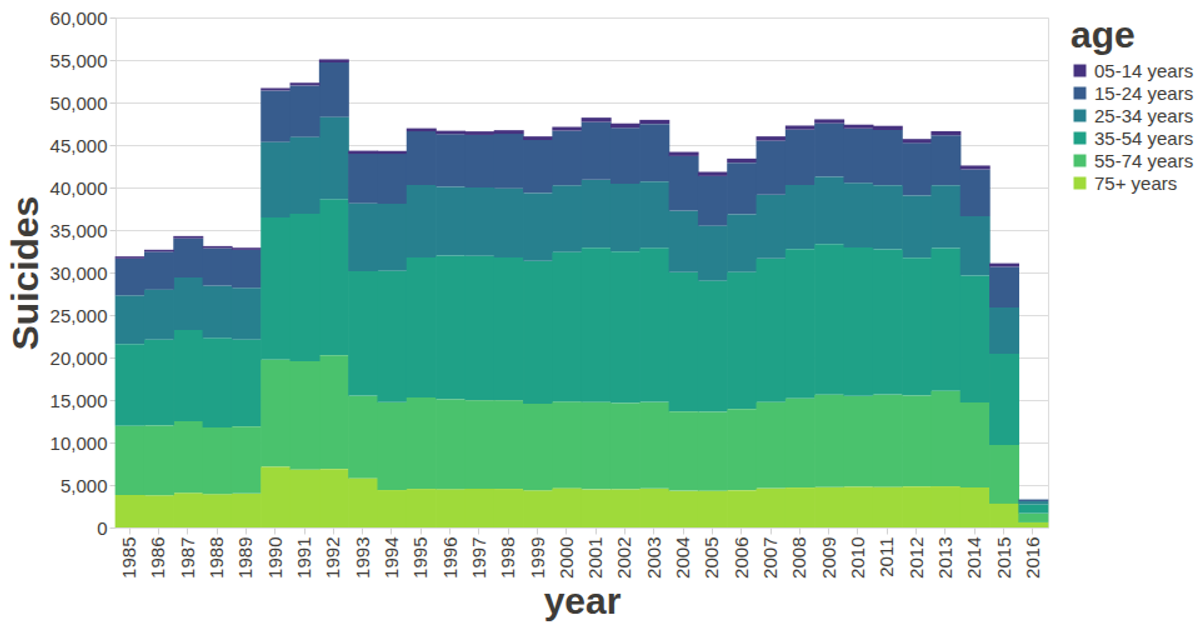
This stacked bar chart visualizes global suicide rates over 30 years, grouped by age, using aggregated counts per year. The visualization encodes age categories as colors and uses the y-axis for time, with bar size reflecting the number of cases. It is built with the vega-lite-api, which wraps Vega-Lite and Vega, and loads CSV data via d3.csv. The chart features a custom color scale and tooltips to show aggregated counts for each age group.
AI-generated descriptionA stacked bar charts visualize the changing trend by year and age.
Data Source: SUicide Rates
A visualization constructed using the vega-lite-api.
MIT Licensed




Comments
Sign in to join the discussion.