🌍 Public
sparkline
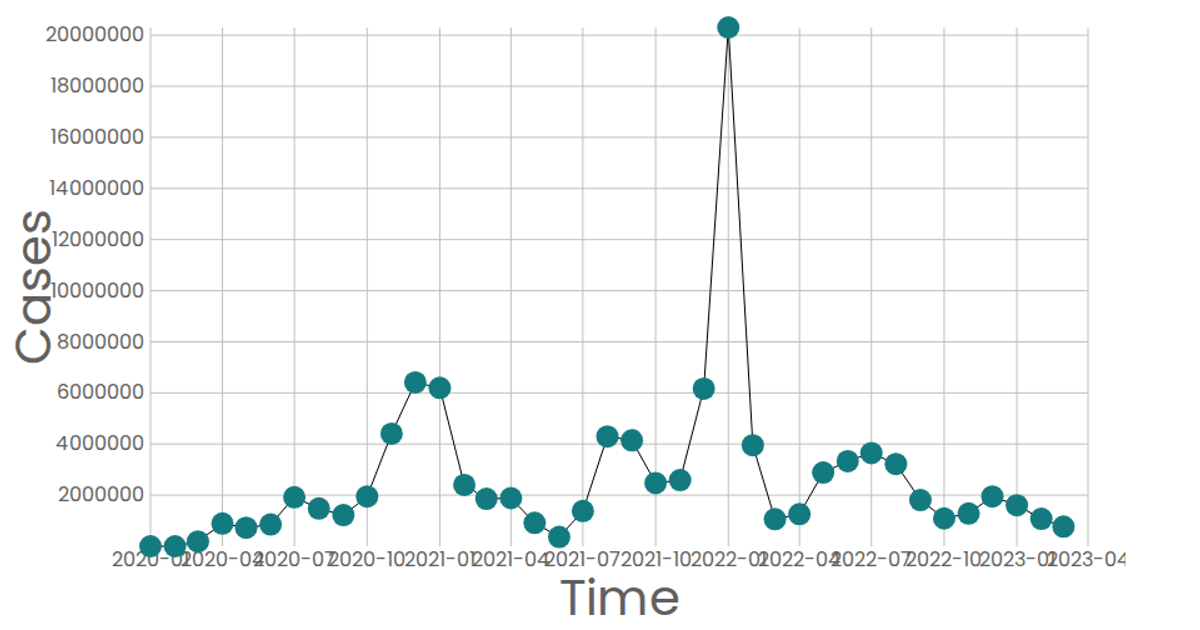
A sparkline-style line chart displays the daily count of news articles associated with a specific cryptocurrency event, "The Golden Crypto Bullrun." The visualization uses a time-scaled x-axis and a linear y-axis to plot the article frequency over a two-day period, with the line rendered as an SVG path. Built with React and D3 v5, it leverages `scaleTime`, `scaleLinear`, `extent`, and `line` from the d3 library, alongside custom axis components. The data is embedded directly in the App component, showing a simple, focused example of trend visualization.
AI-generated descriptionAxes with 3D
MIT Licensed



Comments
Sign in to join the discussion.