🌍 Public
Dynamic Simplification PoC
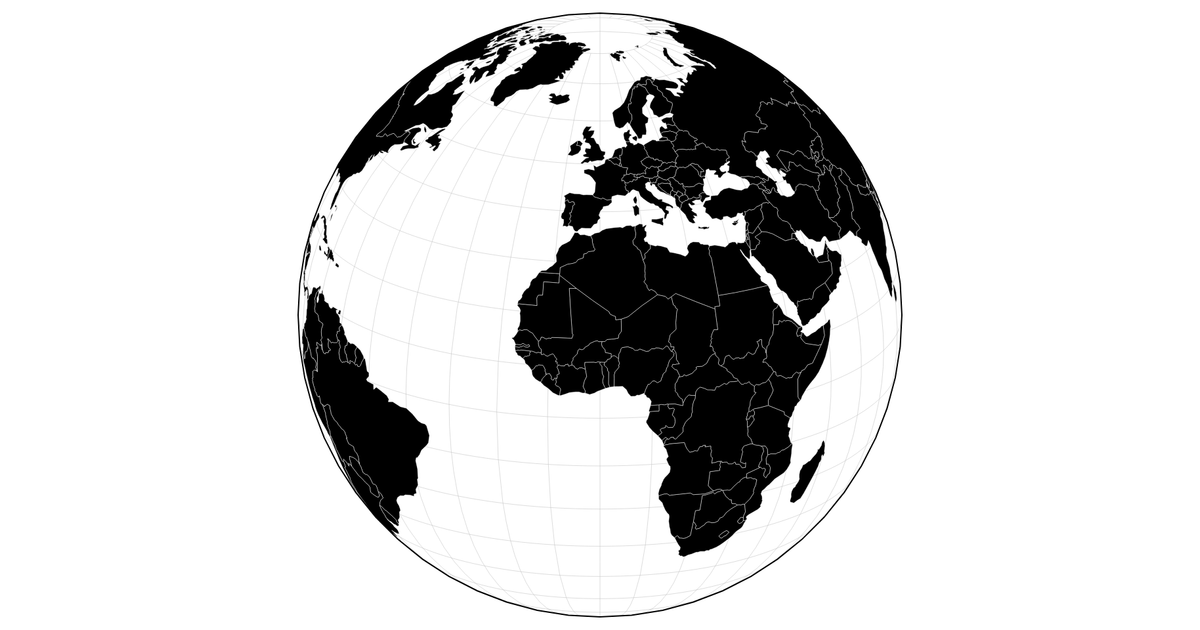
This interactive visualization demonstrates dynamic line simplification on a world map, where the level of detail adjusts as the user zooms in and out. It renders an orthographic projection of world country boundaries using the D3 `geoOrthographic` and `geoPath` APIs onto a Canvas, with data from the visionscarto-world-atlas. The code leverages `topojson-simplify` to recompute simplified geometries based on the current zoom scale, showing a proof-of-concept for performance-adaptive map rendering.
AI-generated descriptionAn attempt at dynamic line simplification using
topojson.simplify. As you zoom in and out, the
simplification level changes. Not sure the math is right
here, but it's a solid PoC!
Bug: results in glitch with black globe at certain rotations.
MIT Licensed




Comments
Sign in to join the discussion.