🌍 Public
Experimenting with Reusable D3 Scatter Plot
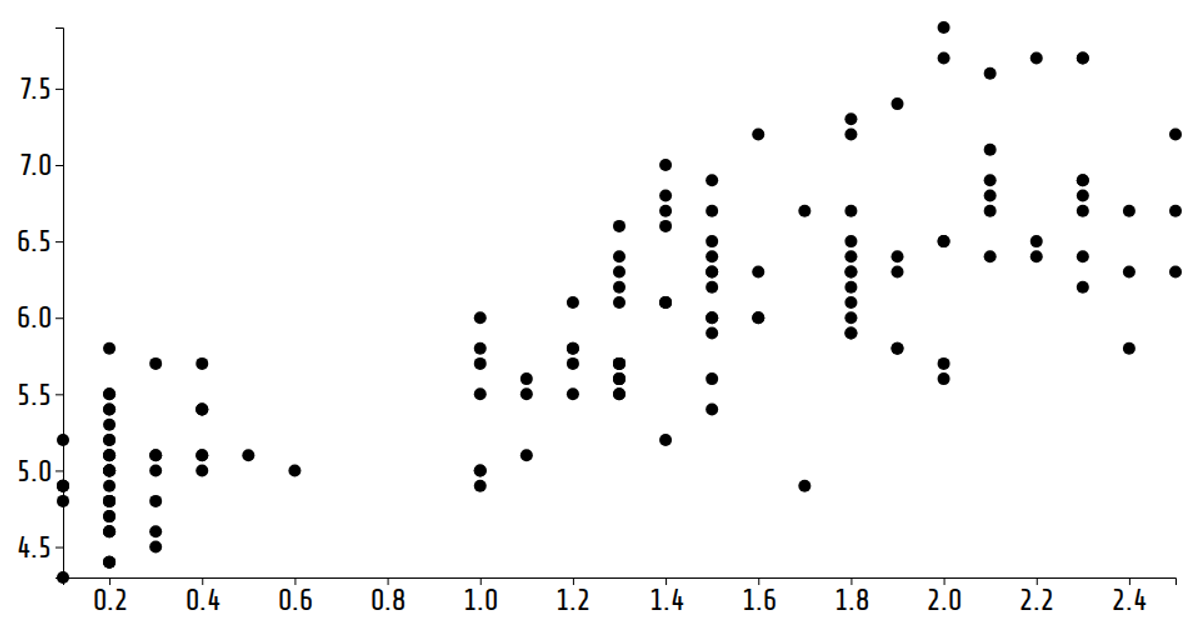
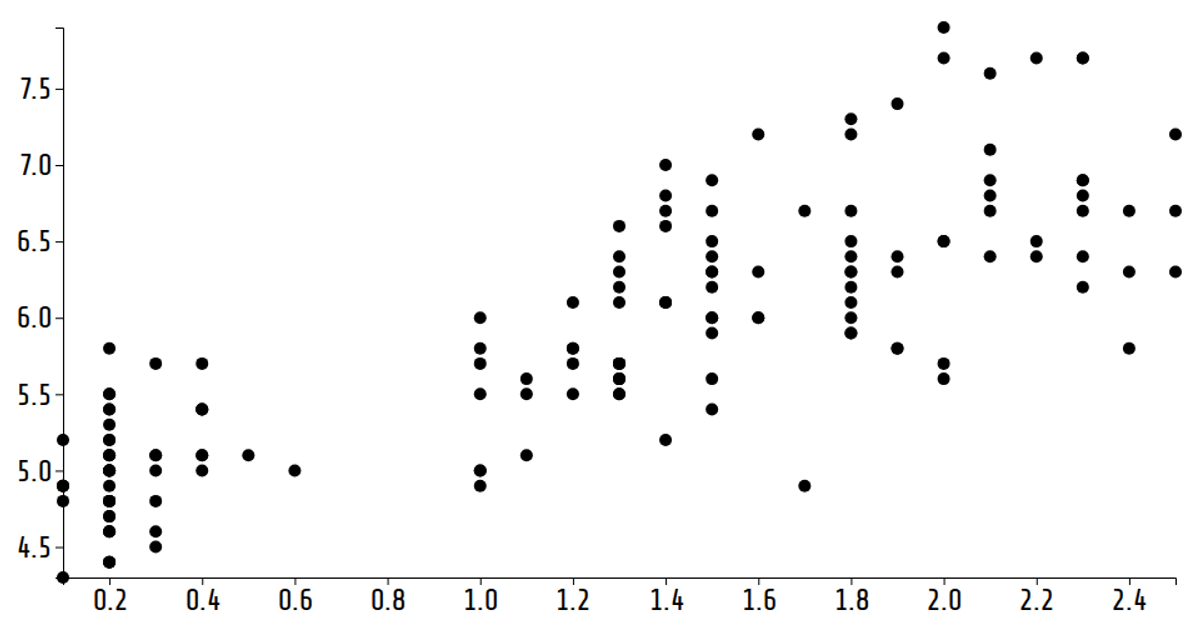
This visualization displays the Iris dataset as a scatter plot, cycling through different pairs of flower measurements every two seconds to explore relationships between variables. Built as a reusable D3 chart following Mike Bostock’s pattern, it uses `d3.scaleLinear`, `d3.extent`, `d3.axisLeft`, and `d3.axisBottom` to render SVG circles and axes. The chart updates dynamically by changing its `xValue` accessor and re-invoking the plot function on an interval, with hover effects styled via CSS.
AI-generated descriptionA reusable scatter plot inspired by Towards Reusable Charts.
Shows the Iris Dataset.
MIT Licensed




Comments
Sign in to join the discussion.