🌍 Public
Fork of CV: pie chart
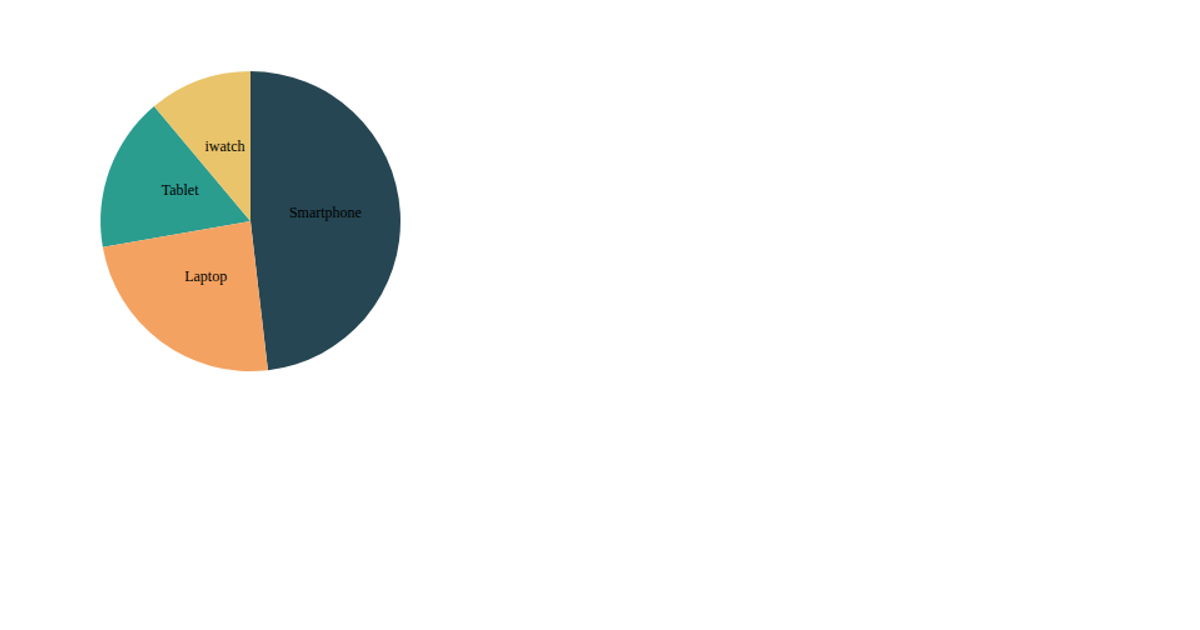
This pie chart visualizes the distribution of device usage across four categories with varying values. A React component renders an SVG, using d3.pie to compute arc segments and d3.arc to generate the paths. The d3.scaleOrdinal function assigns a distinct color to each device. Text labels are positioned at each slice’s centroid with arc.centroid, displaying the device names directly on the chart. The visualization updates automatically when the container size changes, thanks to a ResizeObserver hook that feeds dimensions into the rendering logic.
AI-generated descriptionMIT Licensed






Comments
Sign in to join the discussion.