🌍 Public
task_3 sekhar
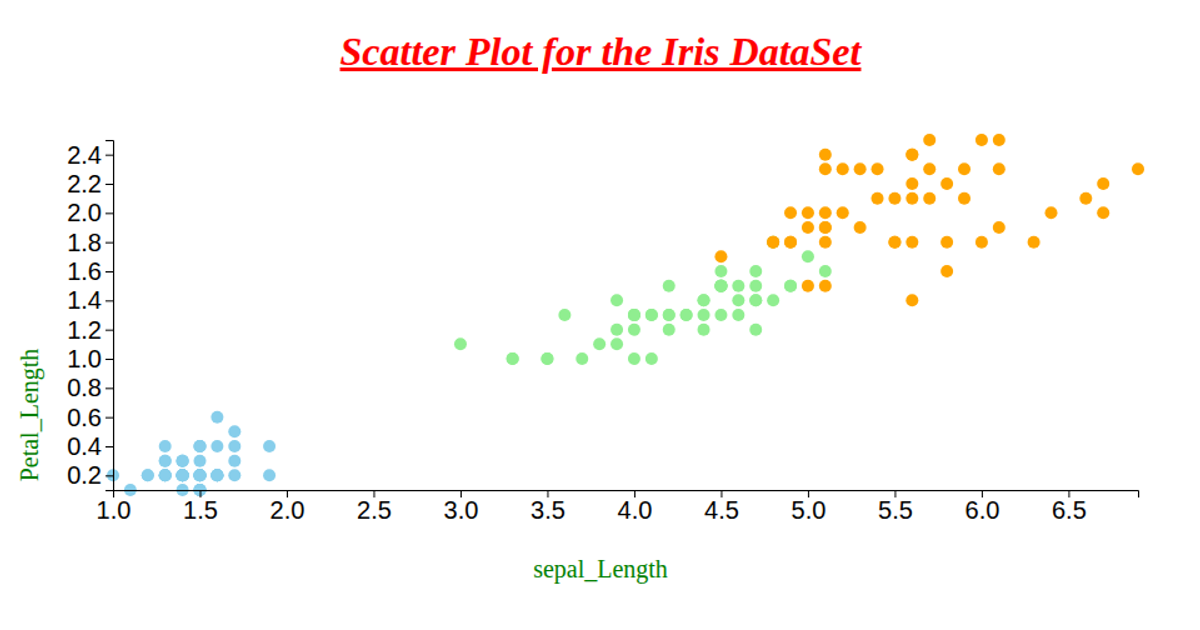
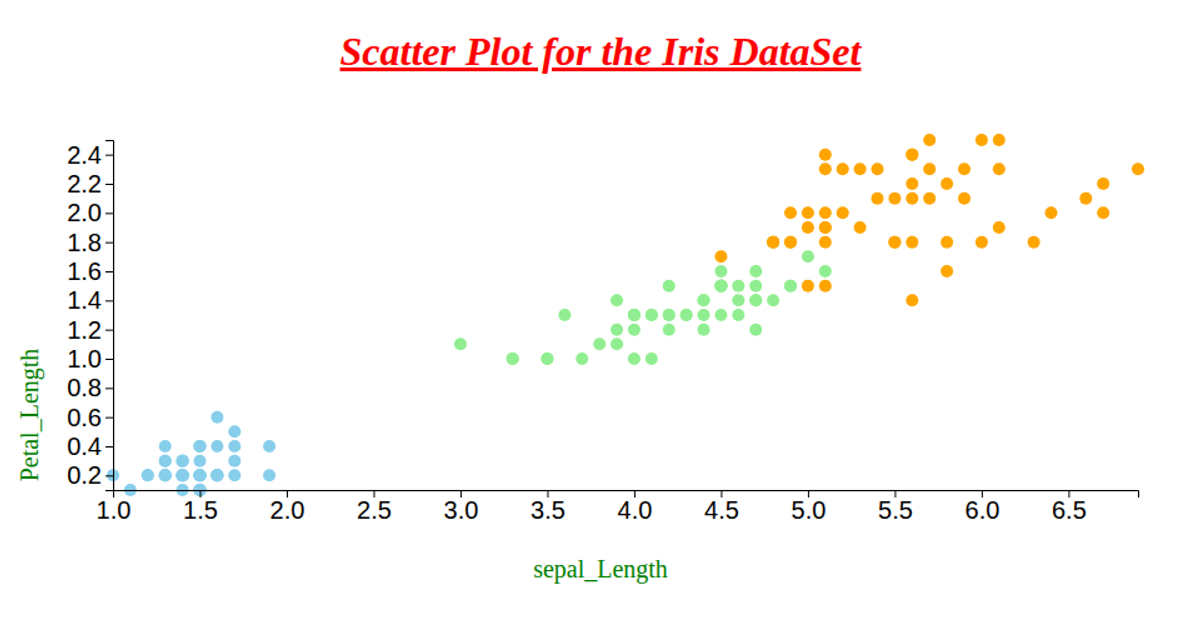
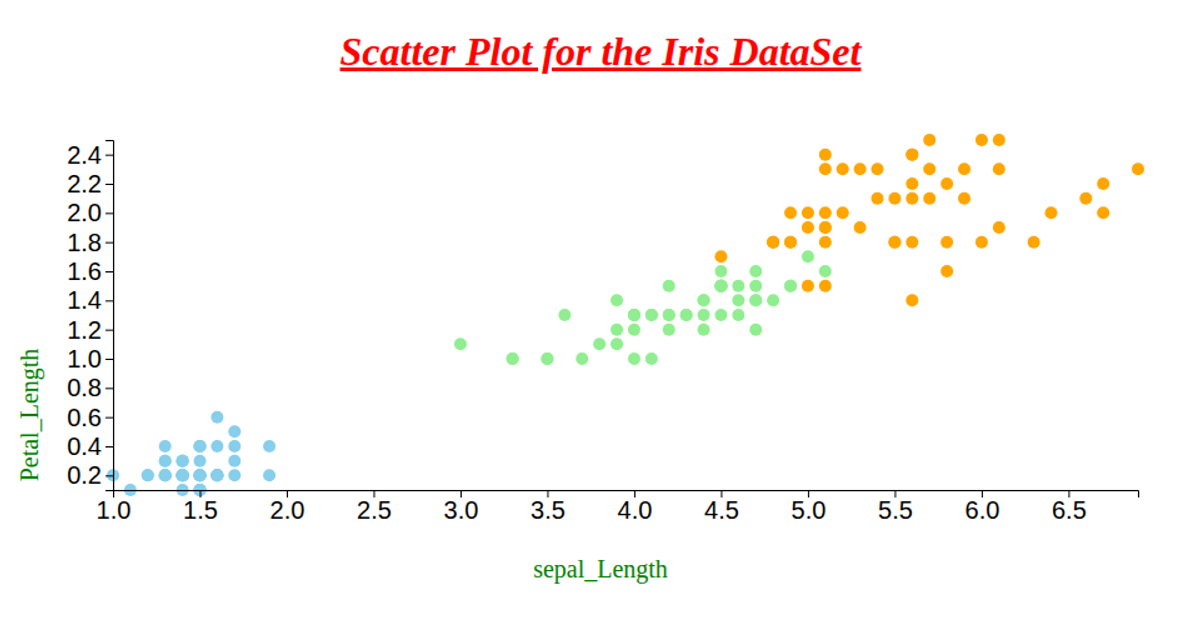
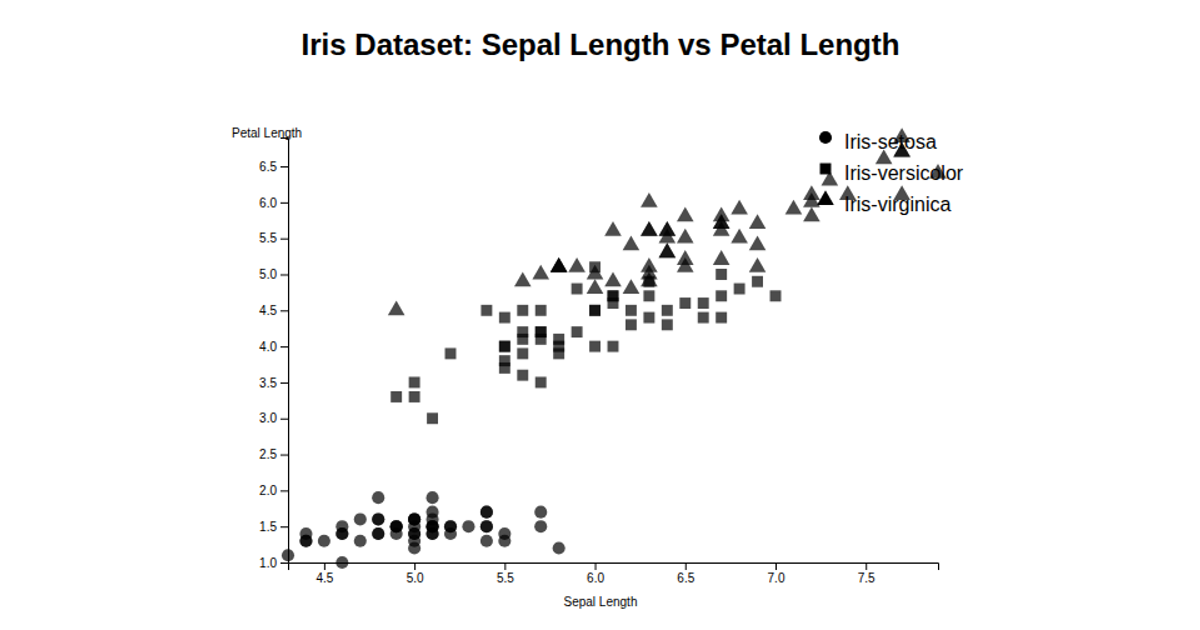
This scatter plot visualizes the Iris dataset, showing the relationship between petal length and petal width, with each of the three species (setosa, versicolor, virginica) colored distinctly (skyblue, lightgreen, orange). The visualization uses D3 v6 (d3.scaleLinear, d3.extent, d3.axisLeft, d3.axisBottom) to map data to SVG circles, with axes labeled and the dataset loaded via d3.csv from a GitHub raw URL. The code also references sepal measurements as attributes on the circles, though these are not visually encoded in the final rendering.
AI-generated descriptionMIT Licensed



Comments
Sign in to join the discussion.