🌍 Public
map
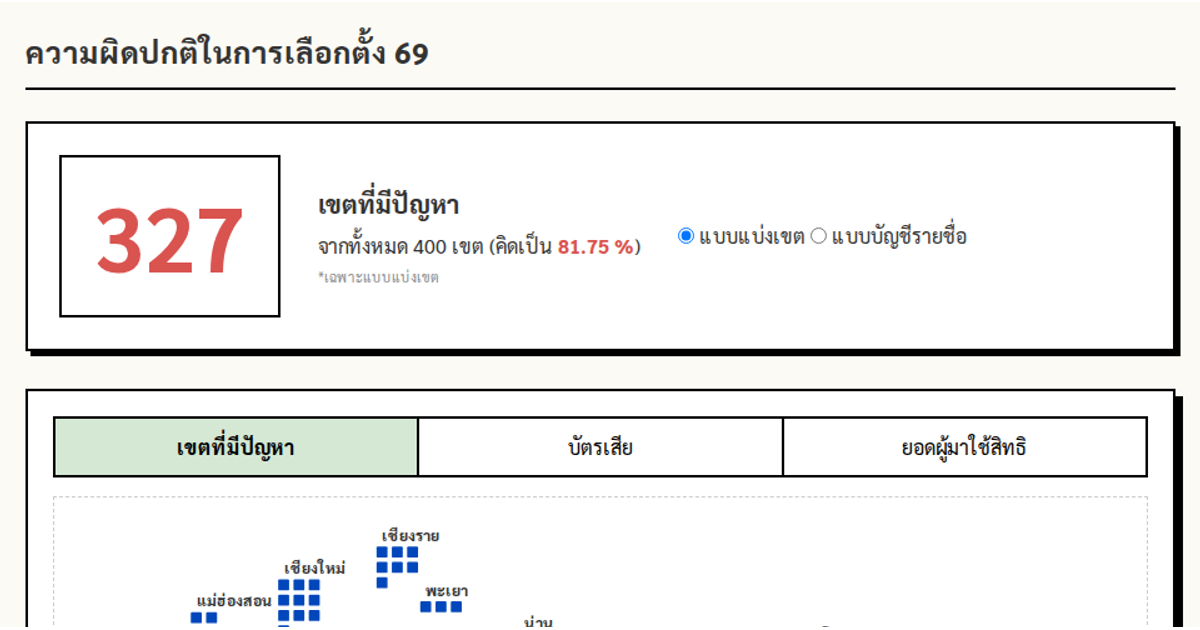
This interactive dashboard visualizes election results across Thai provinces, combining a geographic map with a dot-matrix chart. The map renders GeoJSON data using d3.geoMercator and d3.geoPath, with tooltips displaying province names and click events triggering alerts. A separate bivariate choropleth legend uses a color matrix to show relationships between electoral irregularities and victory margins. The visualization supports filtering by political party and election type (district or party-list), with interactive features including hover tooltips and animated state changes. The layout integrates multiple D3.js components including SVG rendering and custom color schemes.
AI-generated descriptionMIT Licensed




Comments
Sign in to join the discussion.