🌍 Public
ICE 8: My Network
PPlatoch
Last edited Apr 5, 2022
Created on Apr 5, 2022
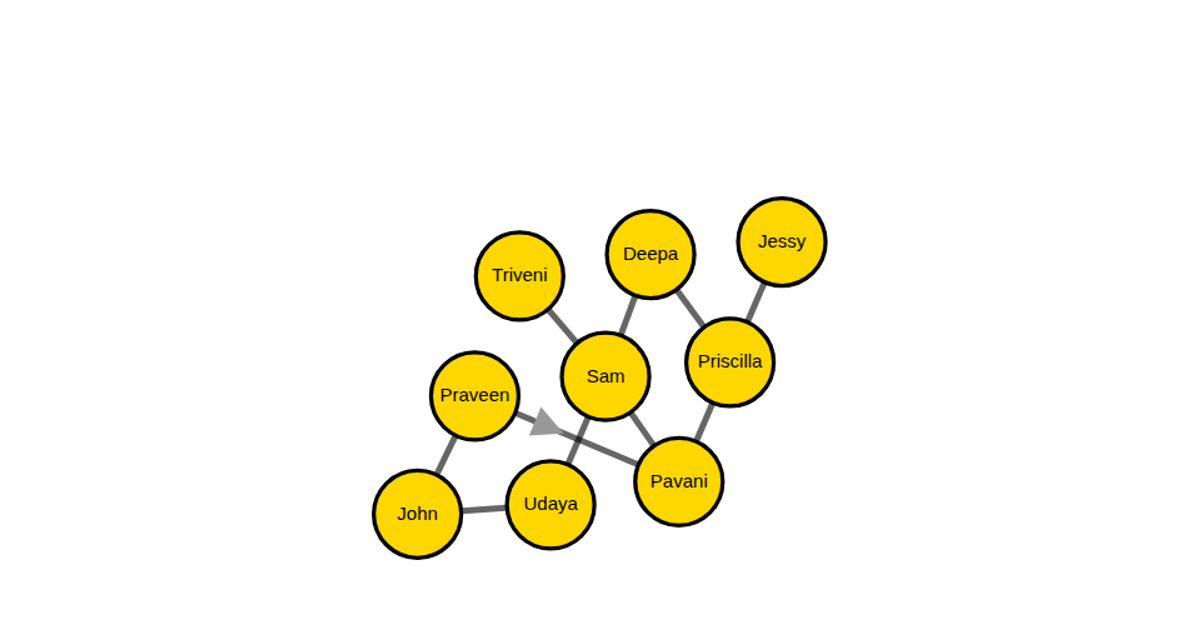
A network diagram shows the social connections of a user named Platini, with a central node linking to six contacts and two additional links between those contacts. The graph uses a force-directed simulation to position the nodes, which are rendered as gold circles with text labels. Implemented with D3 v6, the code employs `select`, `forceSimulation`, `forceManyBody`, `forceLink`, and `forceCenter` to run the physics and update SVG circle, text, and line elements on each tick. Data is defined programmatically in JavaScript using node and link arrays.
AI-generated descriptionMIT Licensed



Comments
Sign in to join the discussion.