🌍 Public
Customizing Axes
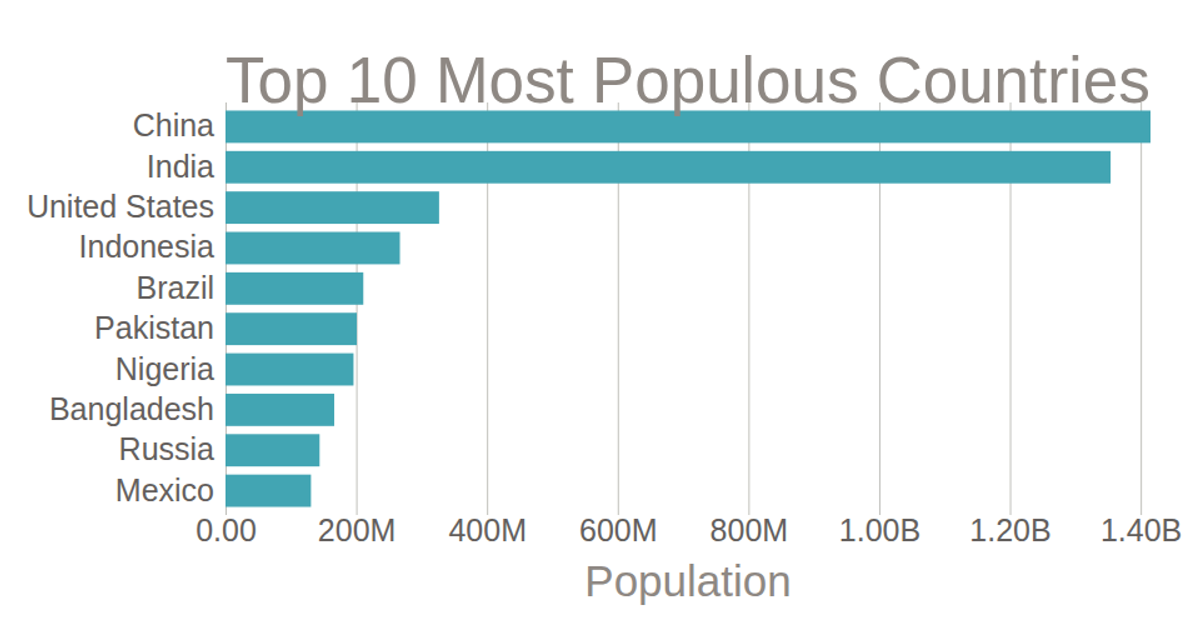
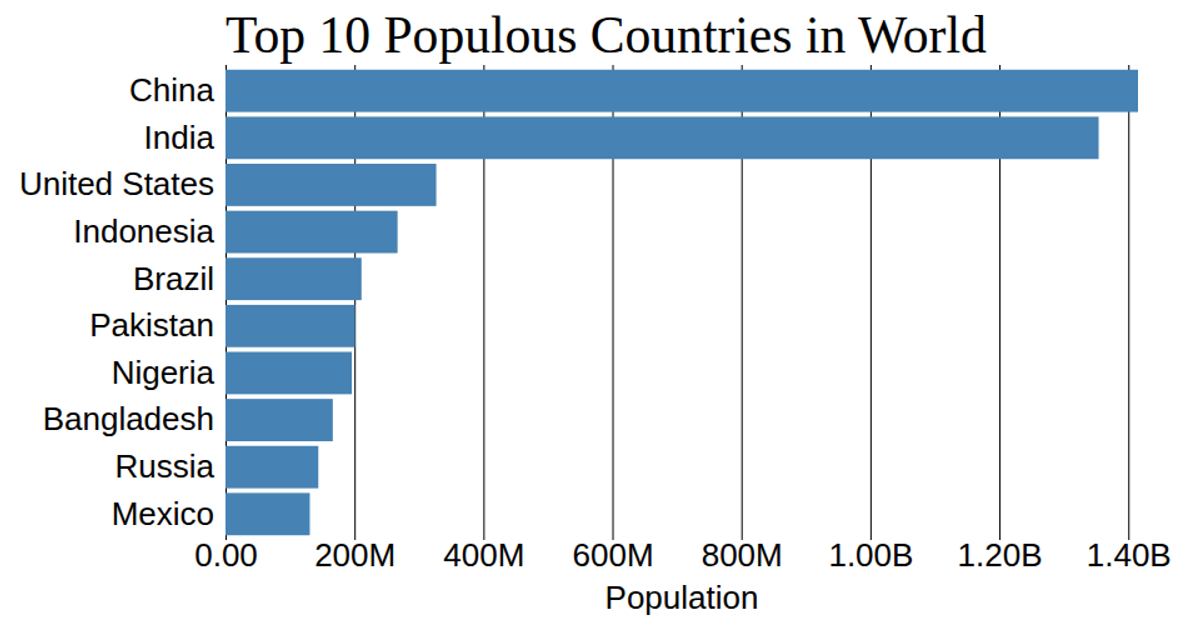
This bar chart displays the population of the top ten most populous countries, using horizontal bars ordered by country name. The code uses D3 v5’s `scaleBand` and `scaleLinear` to map data, while `axisBottom` and `axisLeft` generate the axes with custom tick formatting via `d3.format` to abbreviate large numbers. The y-axis grid lines are removed, and the chart is rendered as SVG with styling from CSS.
AI-generated descriptionMIT Licensed





Comments
Sign in to join the discussion.