🌍 Public
Inverter Temp trend
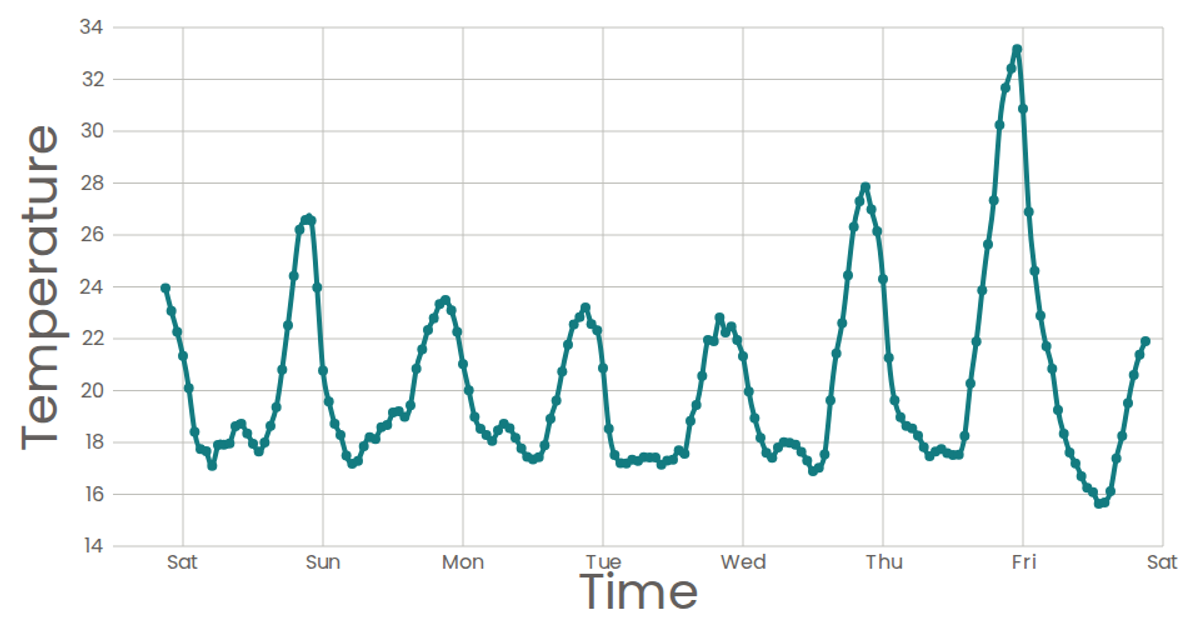
This visualization shows a week-long trend of inverter temperature readings over time, with each data point plotted as a circle on a scatter plot. The chart uses D3 v5 scales (`scaleTime` and `scaleLinear`) to map timestamps and temperature values, and React components to render the SVG axes and marks. Data is loaded asynchronously via `d3.csv` from the Sense Your City dataset, with the bottom axis displaying abbreviated day names and a tooltip showing the full timestamp on hover.
AI-generated descriptionA scatter plot of Data Canvas Sense Your City Dataset.
MIT Licensed




Comments
Sign in to join the discussion.