🌍 Public
Area_Chart
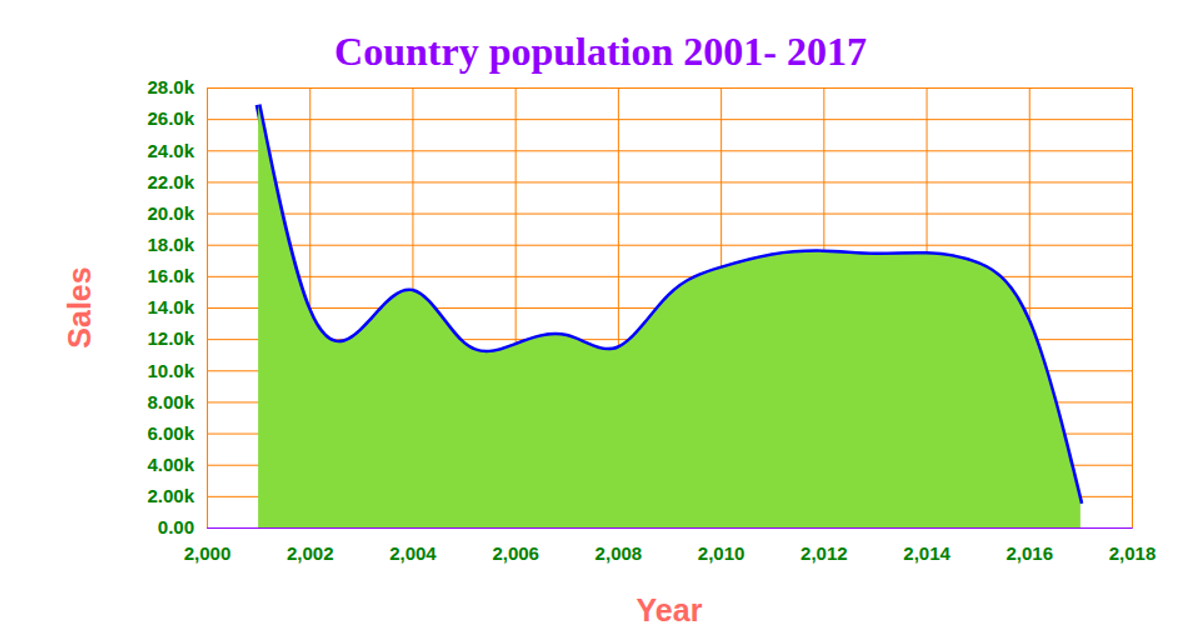
This area chart shows the number of passengers traveling with Qatar Airways from 2011 to 2021, drawn as a smooth, maroon-filled curve with a black outline. Using D3 v5, the code loads CSV data, parses dates with `d3.timeParse`, and builds scales with `scaleTime` and `scaleLinear`. It generates the line and area paths with `d3.line` and `d3.area`, applies `curveBasis` for smoothing, and renders axes with grid lines via `axisBottom` and `axisLeft`.
AI-generated descriptionMIT Licensed




Comments
Sign in to join the discussion.