🌍 Public
Customizing Axes
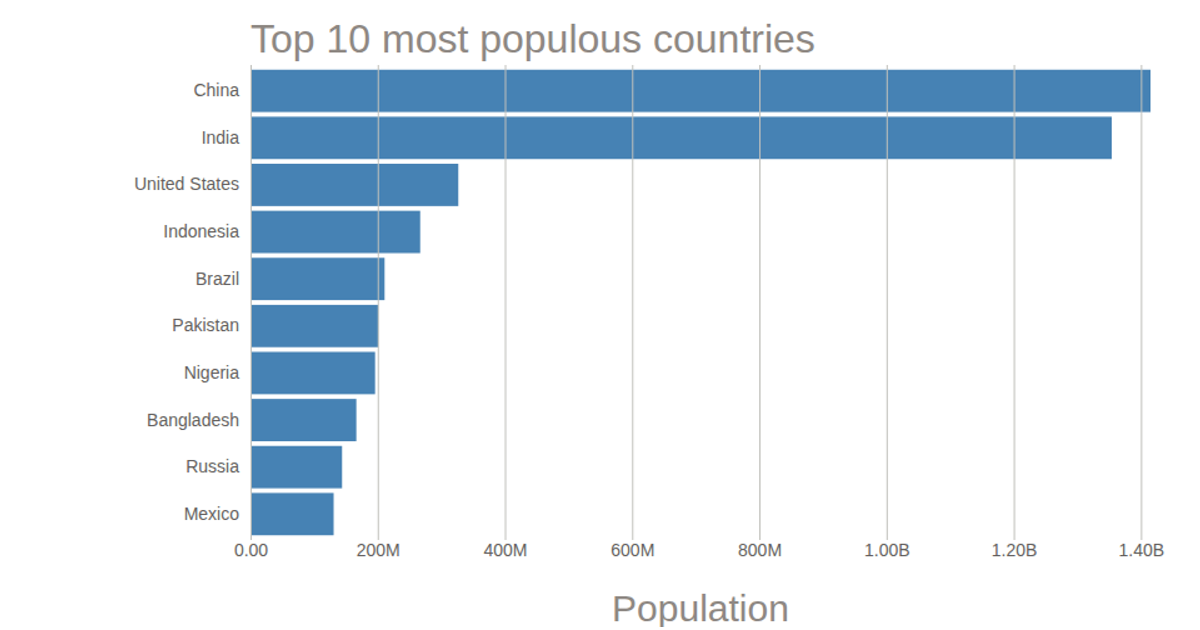
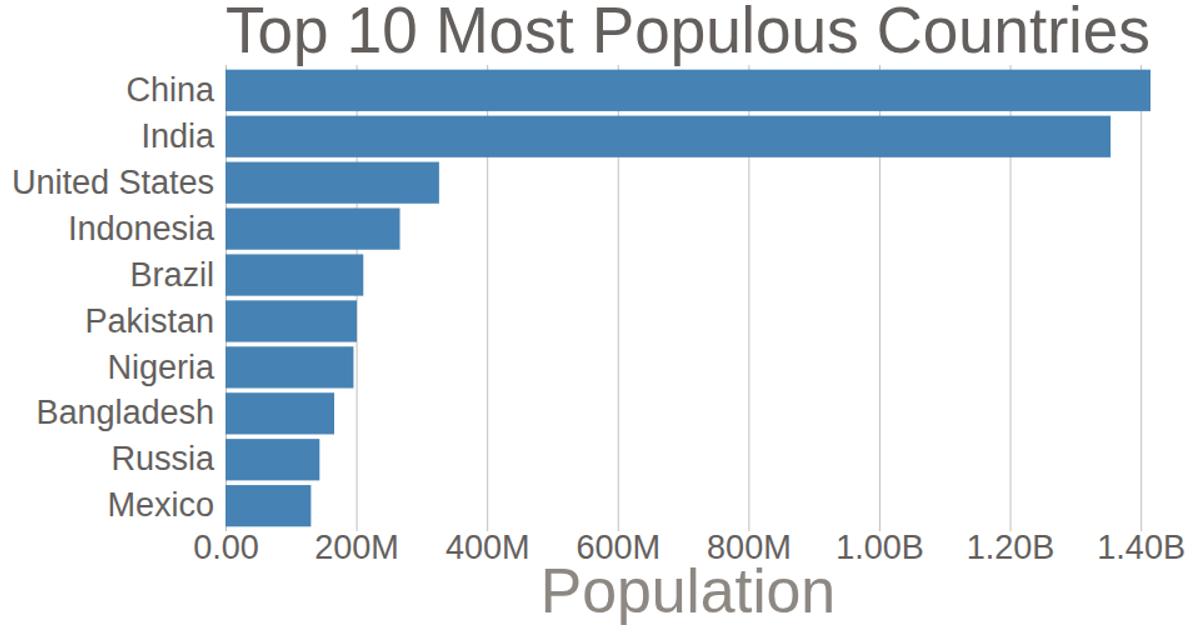
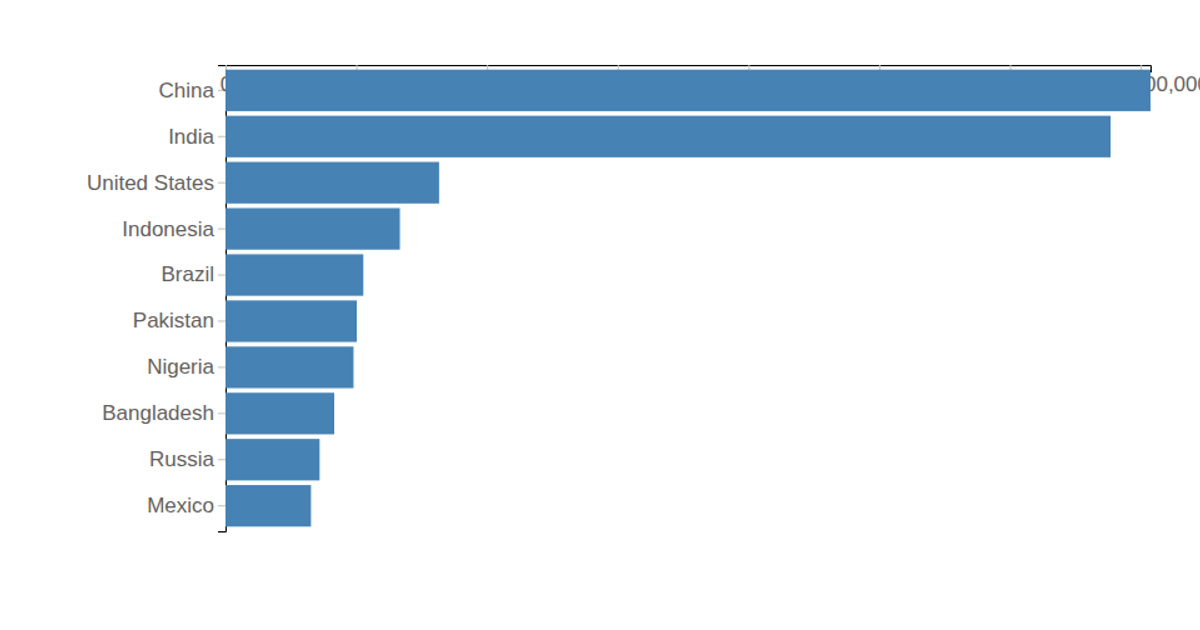
This bar chart displays the populations of the top 10 most populous countries, based on 2008 estimates from the UN World Population Prospects 2017. It uses D3 v5 with `d3.scaleLinear`, `d3.scaleBand`, `d3.axisLeft`, and `d3.axisBottom` to render an SVG. Custom margins position an inner group, with axis labels and bars drawn via `g.append('rect')`. Data is loaded from a CSV file and preprocessed by multiplying population values by 1000.
AI-generated descriptionThis bar chart shows population of the top 10 most populous countries. These data comes from the year 2008 estimate in UN World Population Prospects 2017.
MIT Licensed





Comments
Sign in to join the discussion.