🌍 Public
Activity 6_Question 4
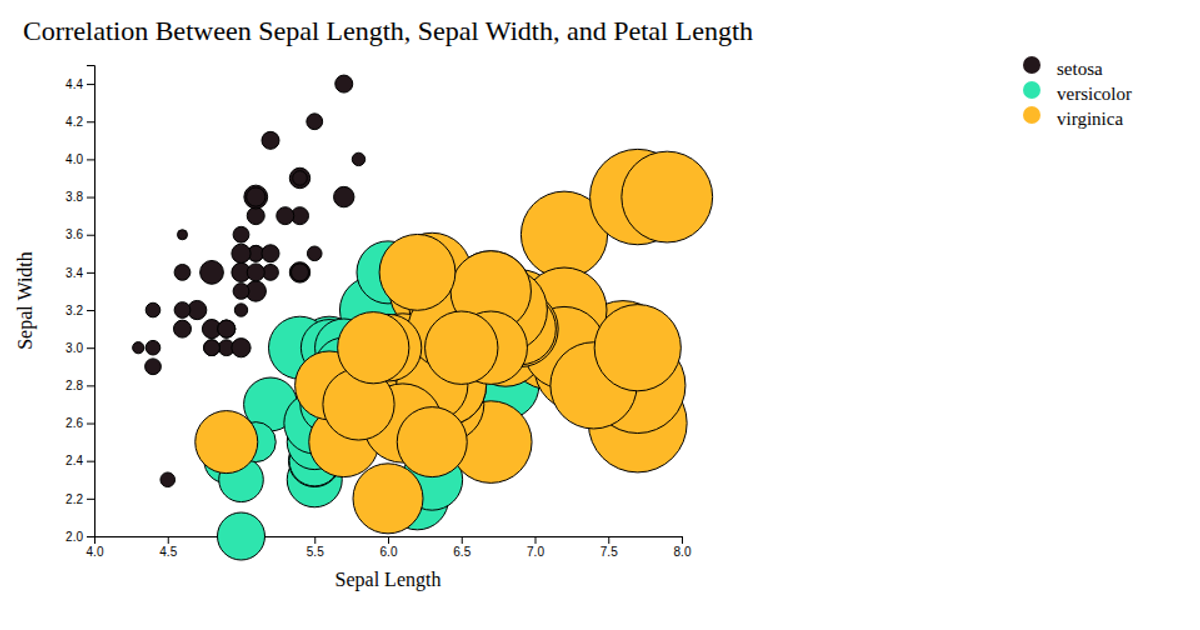
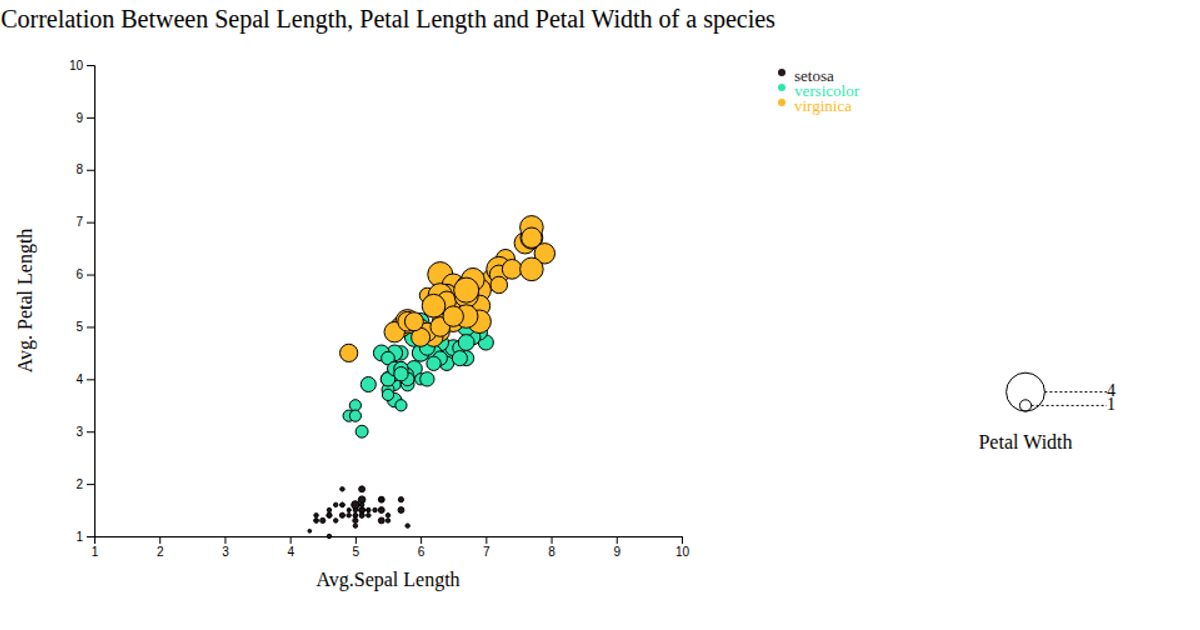
This bubble chart visualizes correlations among sepal length, sepal width, and petal length for three iris species, with petal length encoded as bubble size and species color-coded using a categorical scale built with `d3.scaleOrdinal` and `d3.interpolateTurbo`. It loads data from `iris.csv` and renders SVG circles positioned by linear scales. Interactive tooltips highlight species and petal length on mouseover, while a legend identifies color assignments.
AI-generated descriptionAn example showing the capabilities of VizHub:
- Loads D3 via UNPKG.
- Demonstrates use of
importfrom"d3". - Demonstrates use of
importfrom local ES6 modules.
MIT Licensed



Comments
Sign in to join the discussion.