🌍 Public
Fork of Stylized Bar Chart
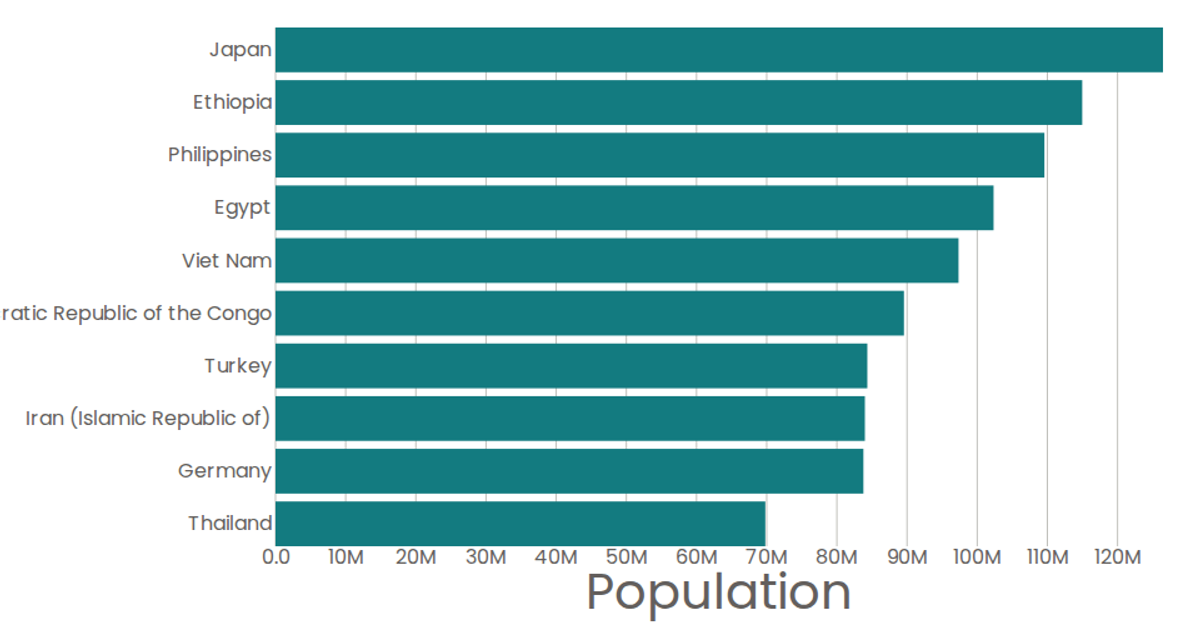
This bar chart displays the Grade values for the top 10 countries in a film-related dataset. The chart uses React to render SVG elements, with D3’s `scaleBand` for the categorical y-axis and `scaleLinear` for the numeric x-axis. Data is loaded via D3’s `csv` function from a GitHub gist, and each bar includes a native SVG `<title>` element for tooltips. The visualization applies a custom Poppins font and teal styling to the marks.
AI-generated descriptionTop 10 as a bar chart.
<!-- Data: [United Nations World Population Prospects 2019](https://gist.github.com/curran/0ac4077c7fc6390f5dd33bf5c06cb5ff). --> <!-- <iframe width="560" height="315" src="https://www.youtube.com/embed/3jIF4Z3iIoM" frameborder="0" allow="accelerometer; autoplay; clipboard-write; encrypted-media; gyroscope; picture-in-picture" allowfullscreen></iframe> -->MIT Licensed






Comments
Sign in to join the discussion.