🌍 Public
Scatter Plot With Slider
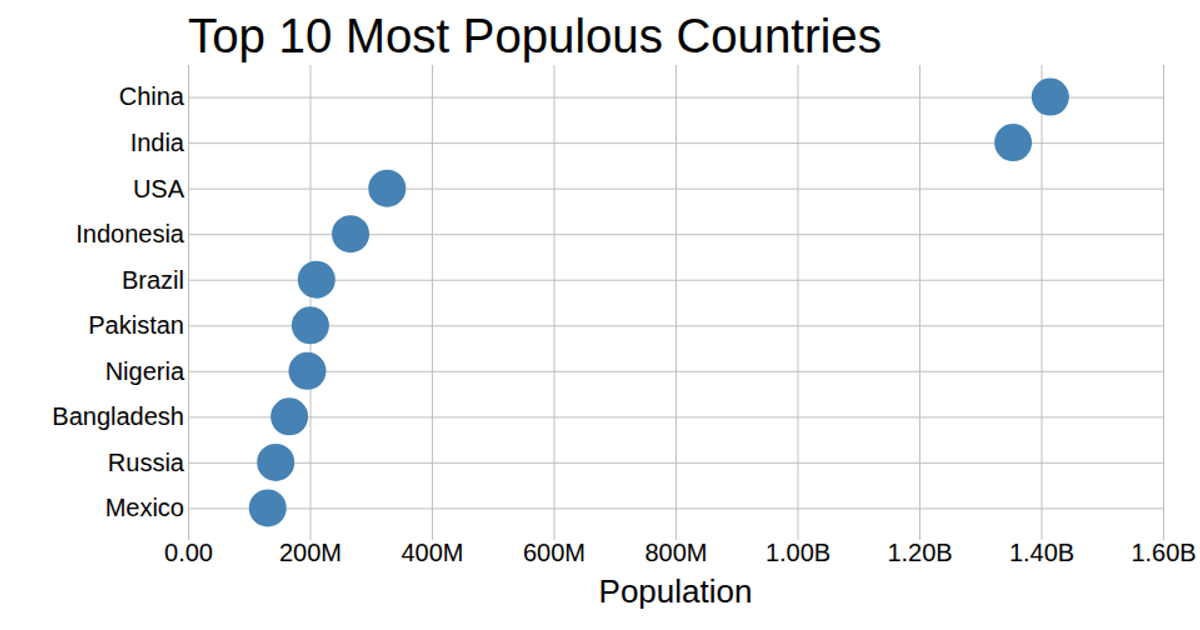
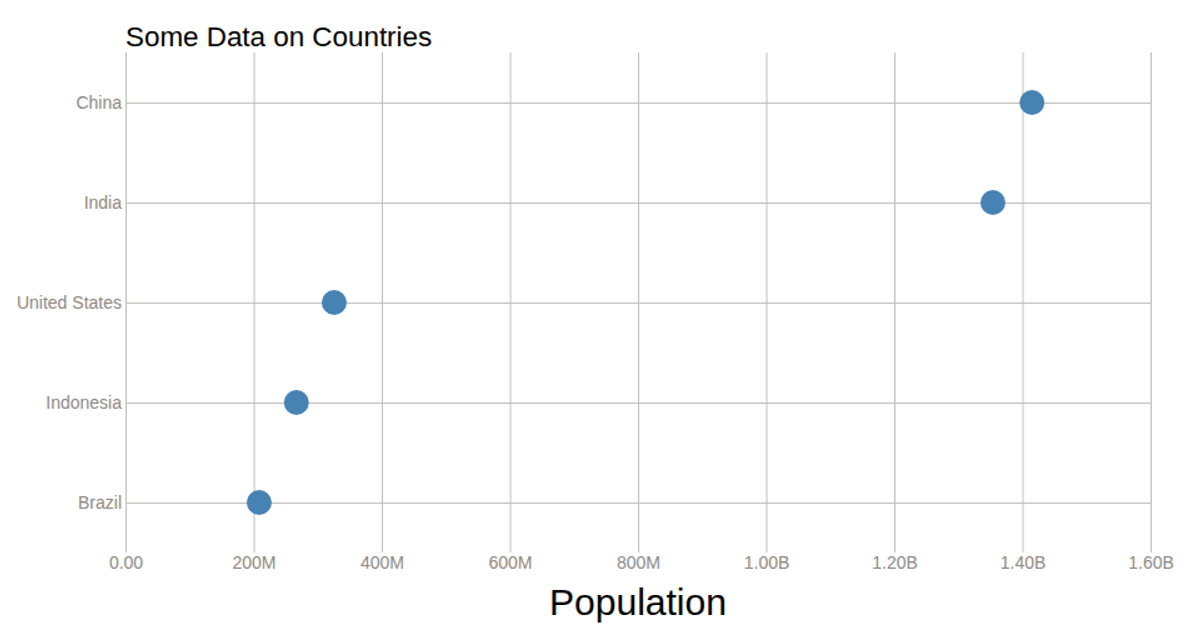
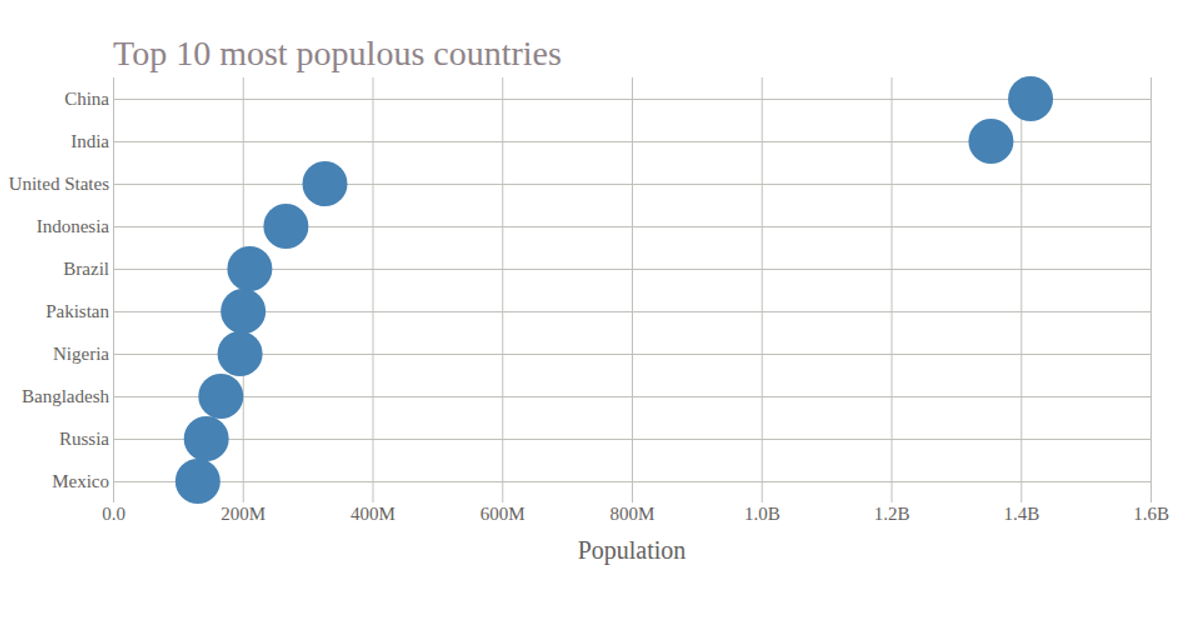
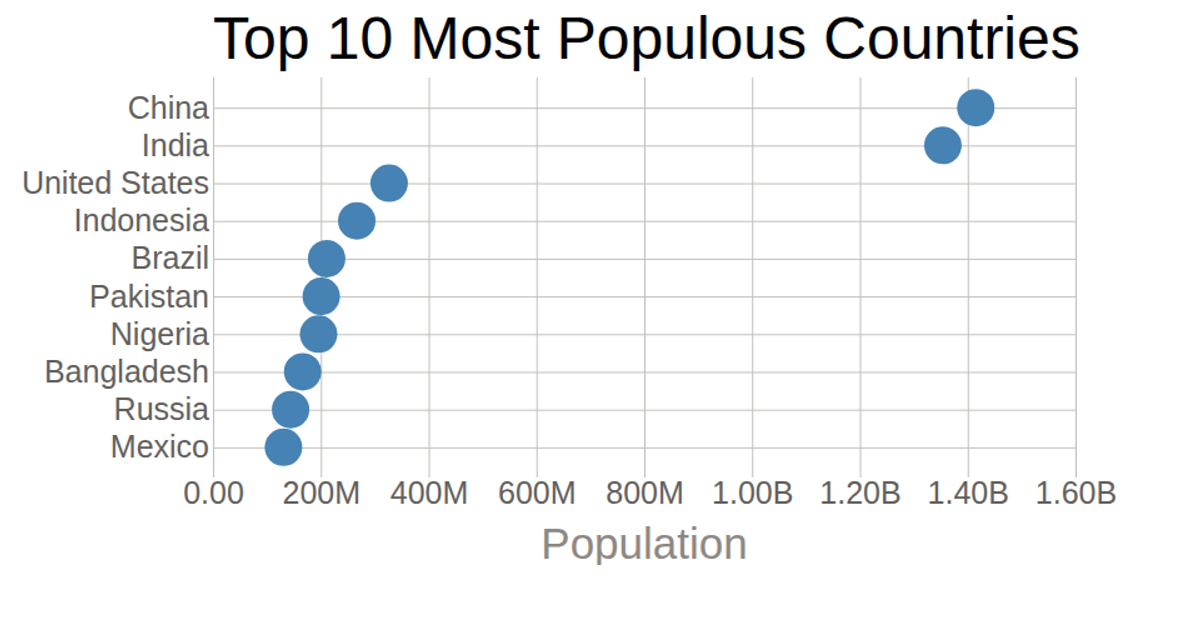
This scatter plot displays country-level data with latitude and longitude mapped to the x and y axes. A slider control dynamically adjusts the maximum x-axis domain, triggering a smooth 1000-millisecond transition that repositions all circles. Built with D3.js v4 and the d3-simple-slider library, the visualization uses SVG rendering and includes interactive tooltips on hover. Data is loaded from a remote CSV file hosted on GitHub.
AI-generated descriptionA bare minimum HTML page.
See also React Starter.
MIT Licensed




Comments
Sign in to join the discussion.