🌍 Public
2 graphs migrants on a map
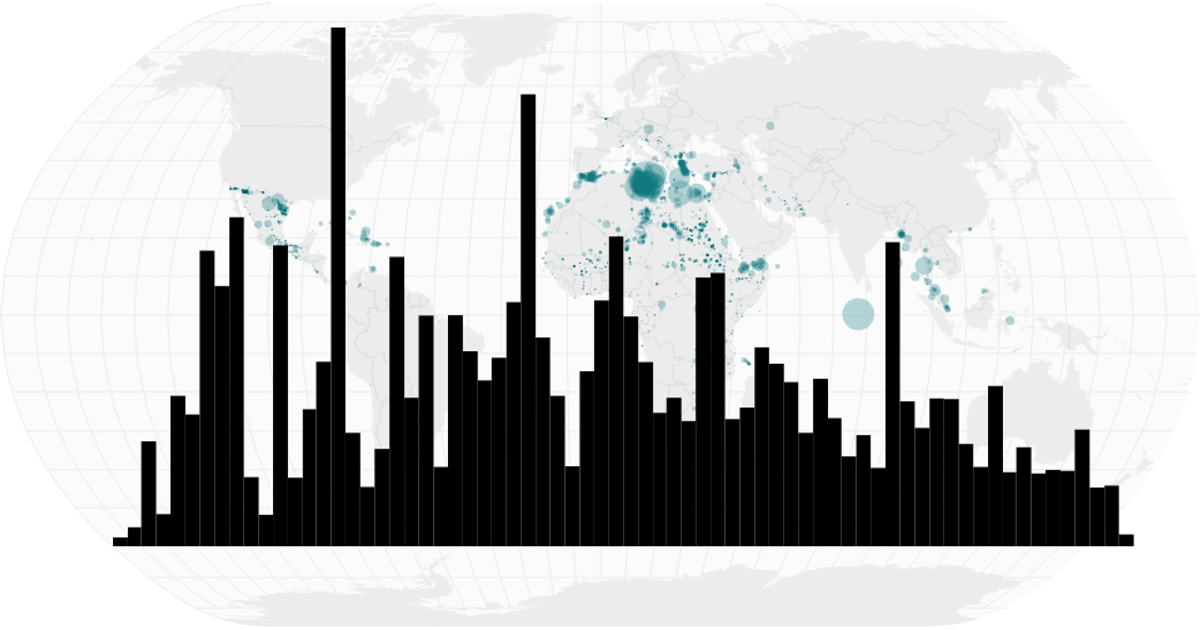
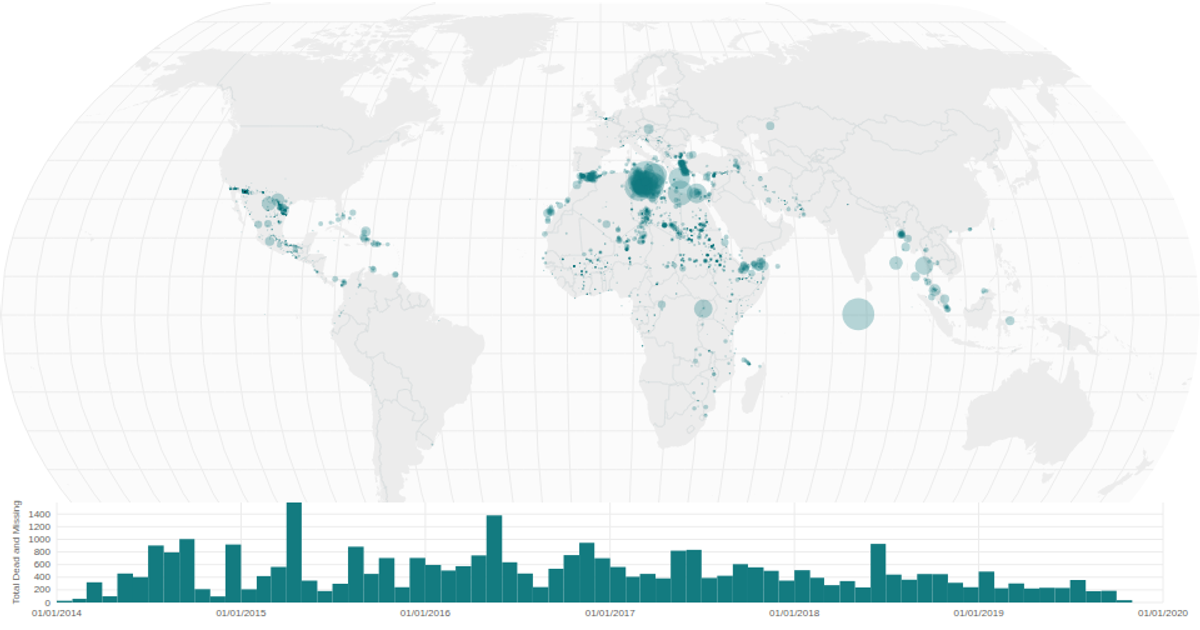
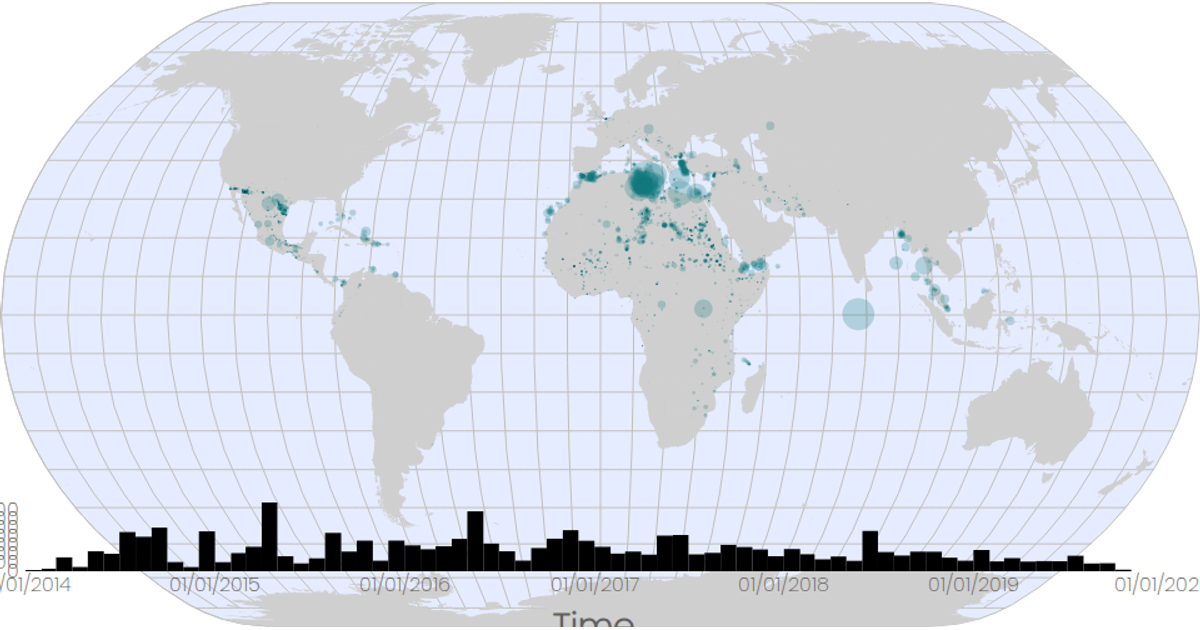
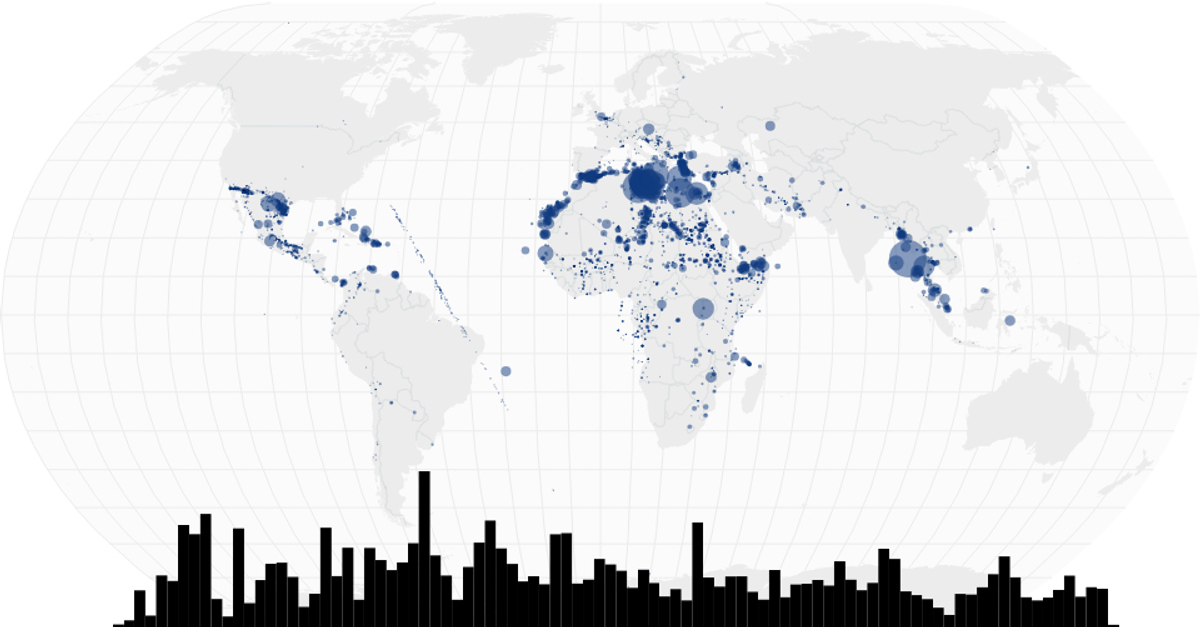
This visualization combines a bubble map and a date histogram to display migrant deaths and missing persons incidents. The map uses D3’s `geoNaturalEarth1` projection with `geoPath` to render world landmasses, graticules, and country interiors, while circles sized by `scaleSqrt` represent the total dead and missing at each coordinate. The histogram, built with `scaleTime` and `bin` from D3, aggregates incidents by month. Both charts render as SVG within a React component, pulling data from a CSV of global migrant incidents and world atlas TopoJSON.
AI-generated descriptionA program that loads in some data about CSS named colors using D3 utilities, and uses React state to keep track of the data.
MIT Licensed




Comments
Sign in to join the discussion.