🌍 Public
Temperature in San Francisco
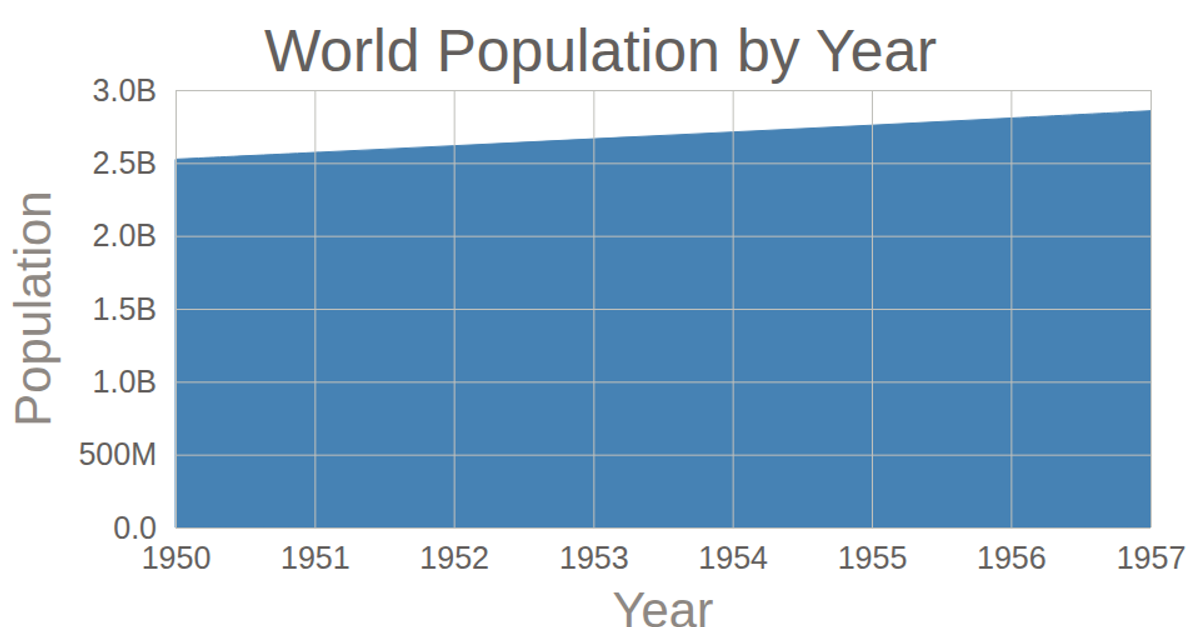
This area chart shows world population by year, with a curved line filling the space beneath it to emphasize change over time. The visualization uses D3 v5's `area` generator with `curveBasis` for smoothing, and employs `scaleTime` and `scaleLinear` to map the data. Axes are rendered using `axisBottom` and `axisLeft` with custom tick formatting, while the data is loaded from a CSV file via `d3.csv`.
AI-generated descriptionMIT Licensed






Comments
Sign in to join the discussion.