🌍 Public
ACTIVITY 7_TASK4
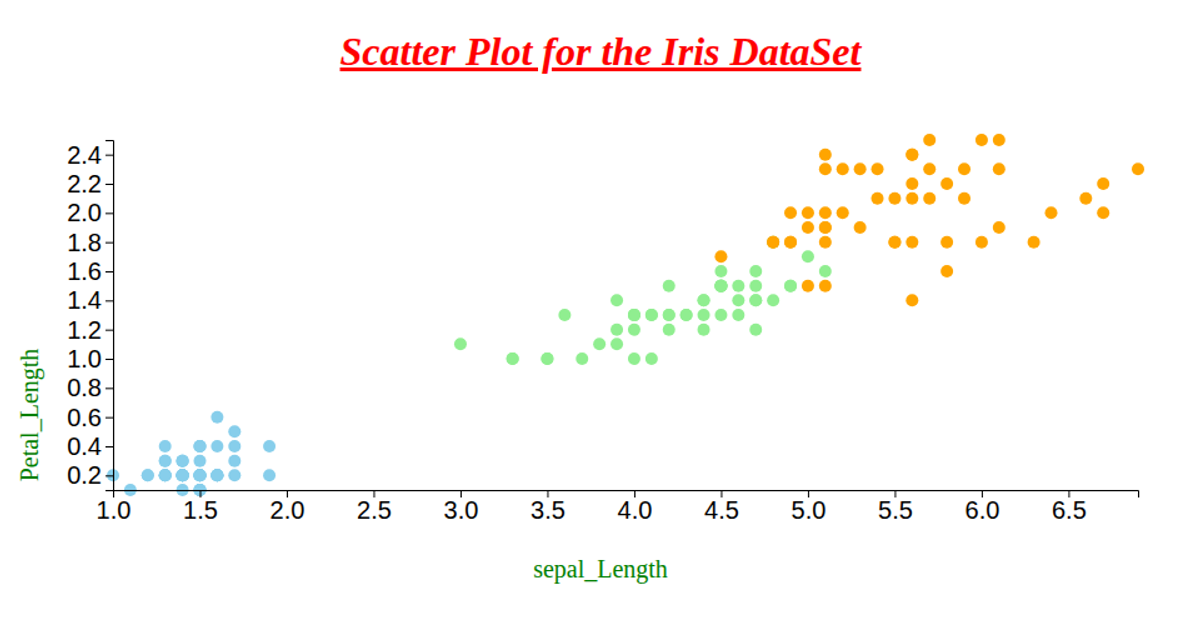
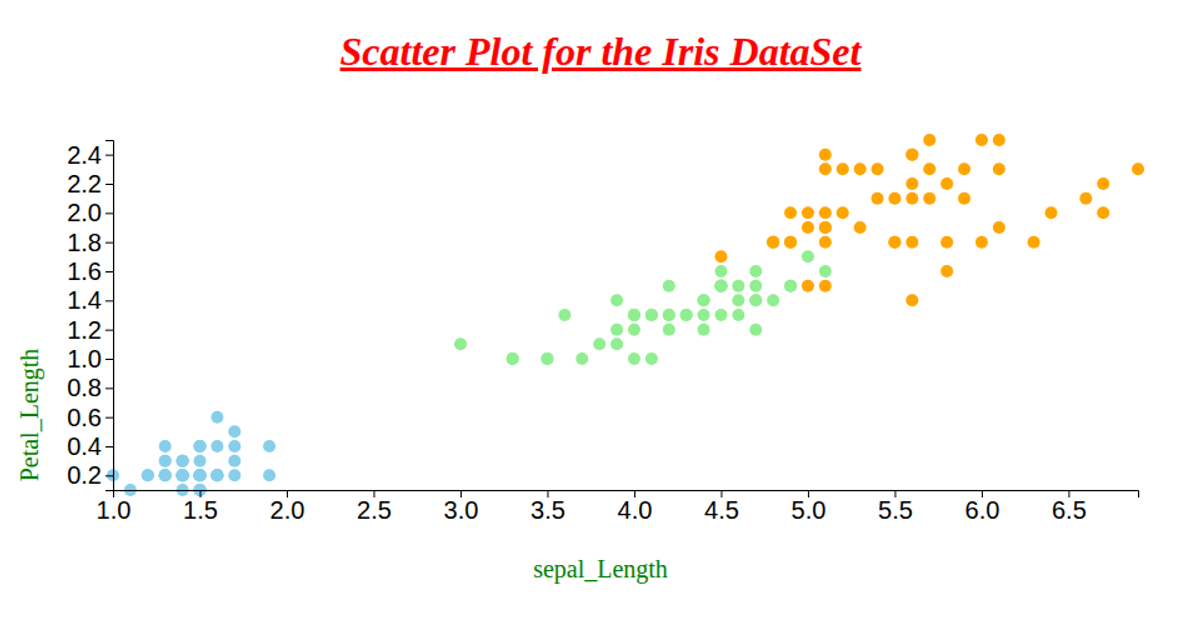
This scatter plot visualizes the Iris dataset, showing petal length on the x-axis and petal width on the y-axis with circles colored by species (setosa, versicolor, virginica) using skyblue, lightgreen, and orange. The visualization also encodes sepal length and width as the circle’s rx and ry attributes, though the radii remain fixed at 5 pixels. Built with D3 v6, it loads CSV data via `d3.csv`, scales positions with `scaleLinear` and `extent`, and renders axes using `axisLeft` and `axisBottom` in an SVG.
AI-generated descriptionWe are Displaying the IRIS dataset using Scatter plot.
MIT Licensed


Comments
Sign in to join the discussion.