🌍 Public
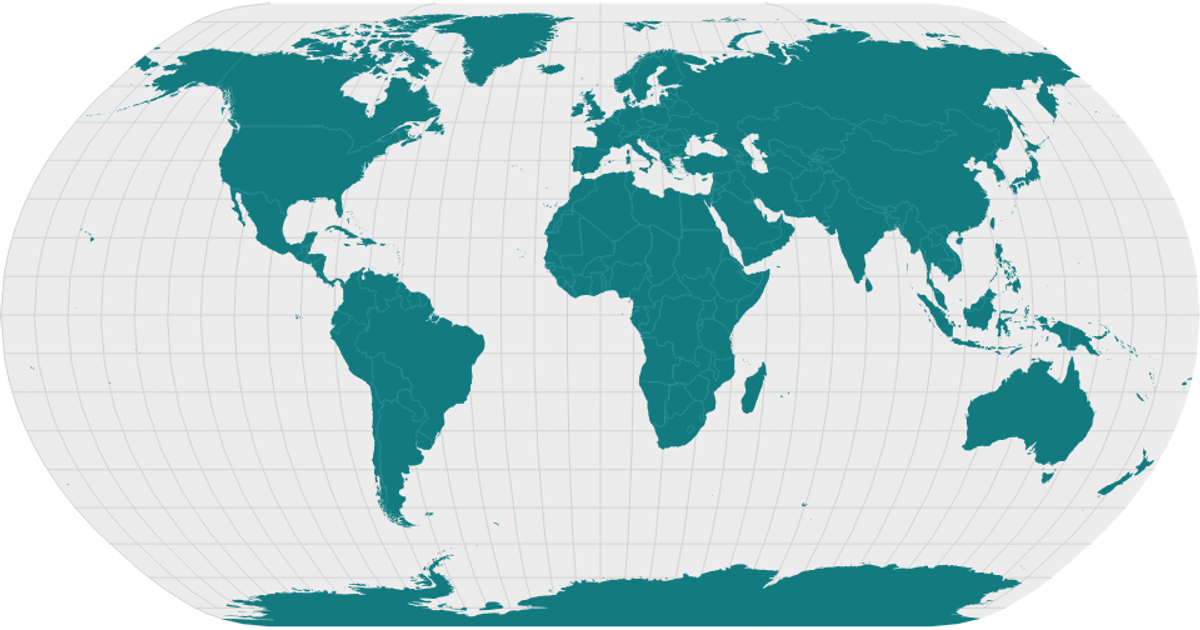
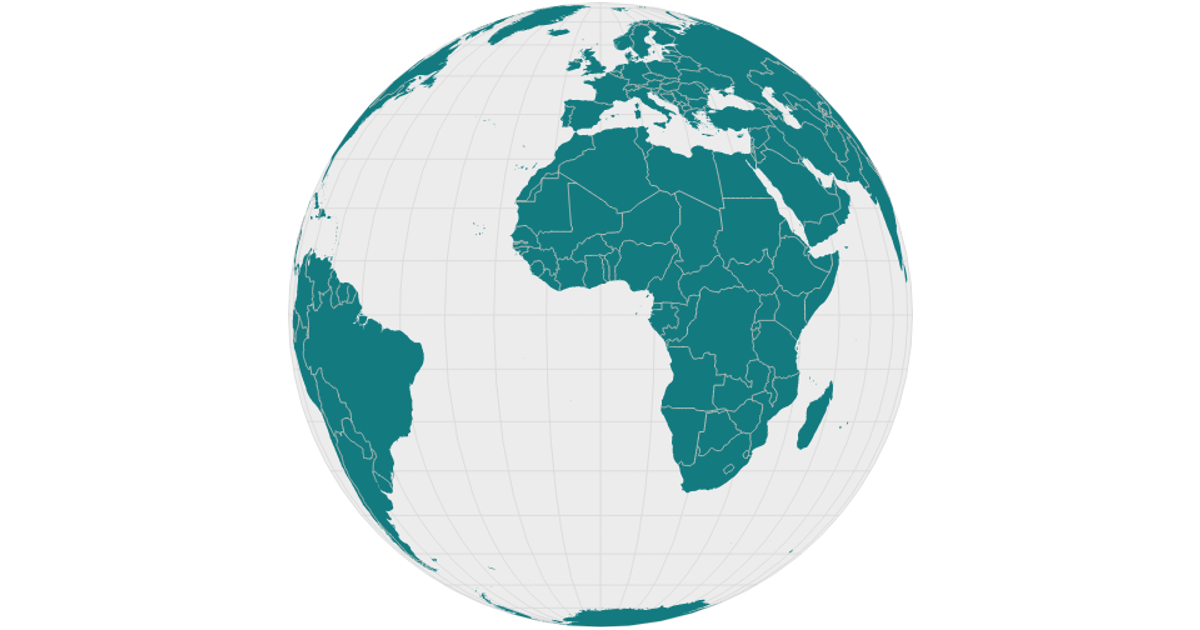
world map with the world Topojson data
This example shows a world map rendered with an equirectangular projection overlaid with graticules and colored interiors. It visualizes landmasses from the world-atlas TopoJSON dataset, filled in green, alongside a light gray sphere background and teal interior boundaries. The visualization uses d3.geoPath, d3.geoEquirectangular, and d3.geoGraticule to project and draw geographic features, with topojson’s feature and mesh functions converting the source data. The React-based code renders the map as SVG elements, with styling applied via CSS classes for each layer.
AI-generated descriptionMIT Licensed



Comments
Sign in to join the discussion.