🌍 Public
Fork of Customizing Axes
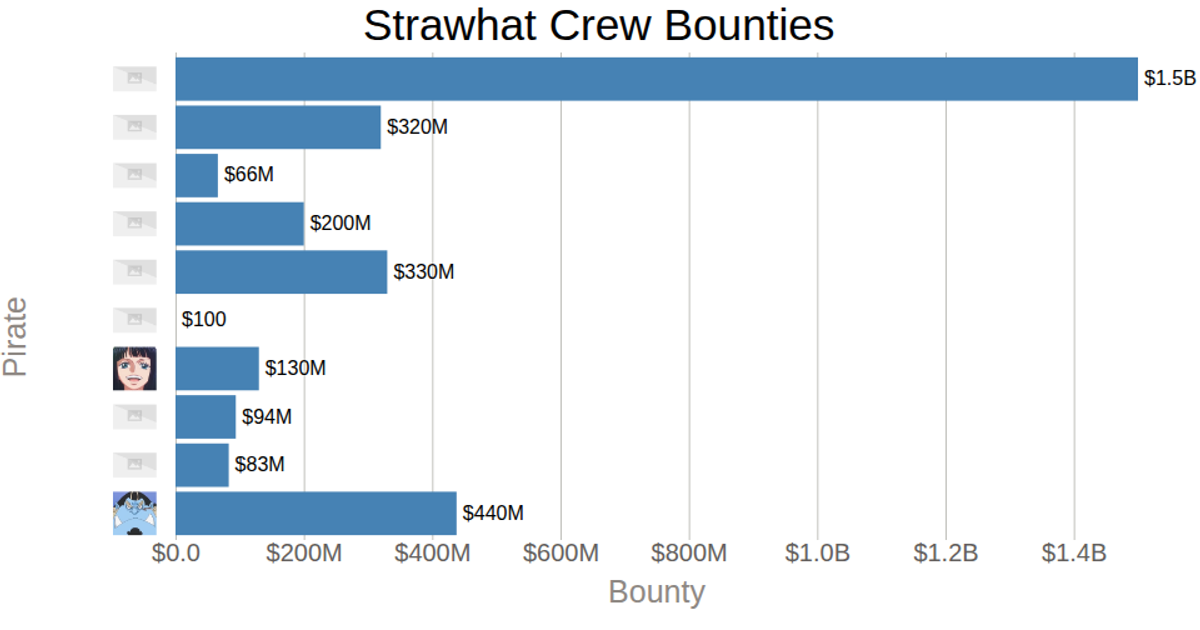
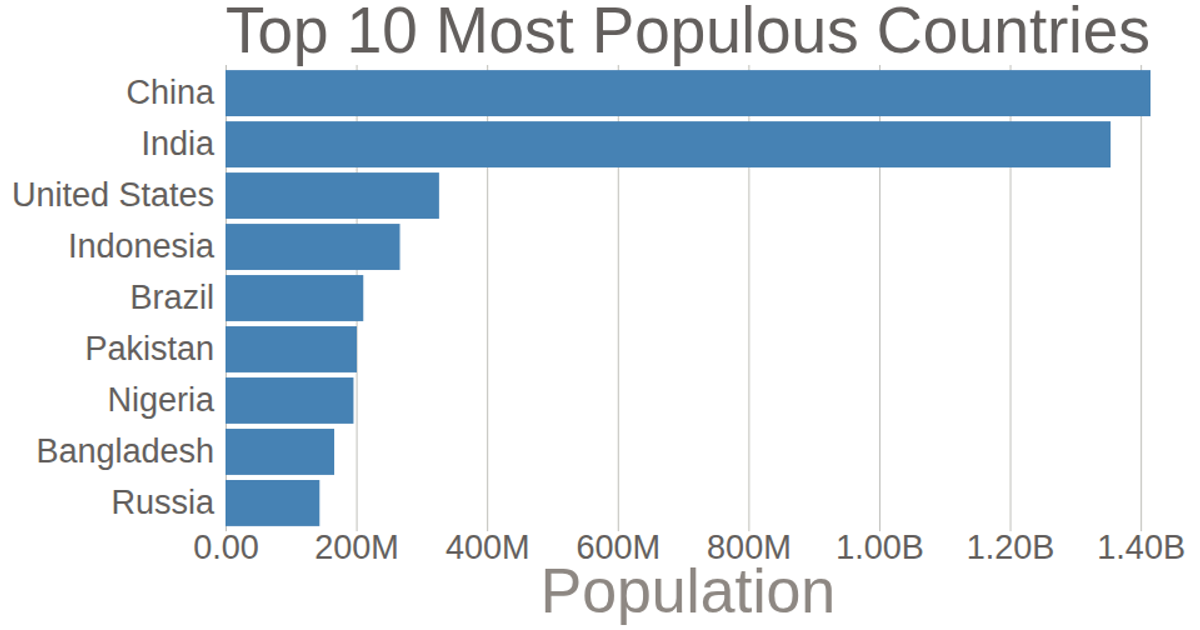
A horizontal bar chart displays the largest One Piece bounties, ranking pirates from Gol D. Roger's 5.56 billion down to Urouge's 108 million. The chart uses the `d3.scaleLinear` and `d3.scaleBand` APIs from D3 v5, with `d3.axisLeft` and `d3.axisBottom` for axes. The x-axis tick labels use `d3.format` with a custom replacement of 'G' with 'B' to convert billions. The data is loaded from a CSV file using `d3.csv`, and bars are rendered as SVG rectangles filled in steel blue.
AI-generated descriptionMIT Licensed




Comments
Sign in to join the discussion.