🌍 Public
Fork of Vega-Lite API Template
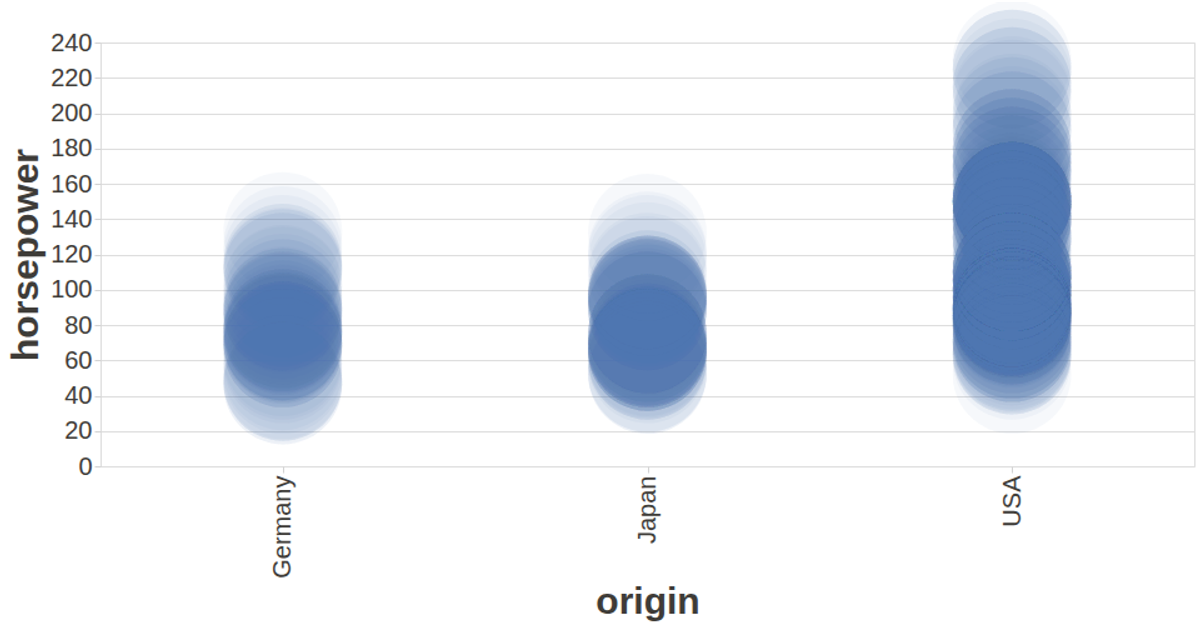
This example uses the Vega-Lite API to create a scatter plot of automobile data from the UCI Machine Learning Repository, plotting the origin of each car against its horsepower. The visualization is configured with custom axis styling and tooltips, and each data point is rendered as a large, semi-transparent circle. The code builds the chart by chaining API calls to `vl.markCircle` and encoding functions, then renders it to an SVG. The underlying data is fetched as CSV using d3, and the resulting chart adapts to the window size.
AI-generated descriptionA visualization constructed using the vega-lite-api.
The data shown here comes from the UCI Machine Learning Repository: Auto MPG Data Set, via Gist: Scatter Plot with Menus.
MIT Licensed



Comments
Sign in to join the discussion.