🌍 Public
ICE-8 Venu
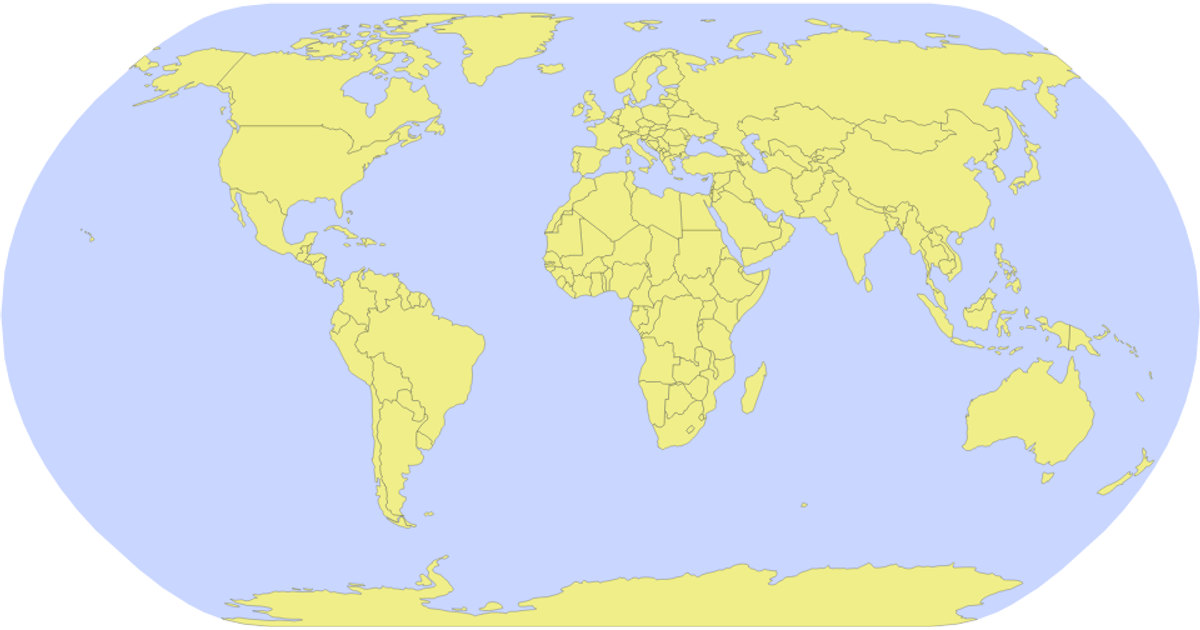
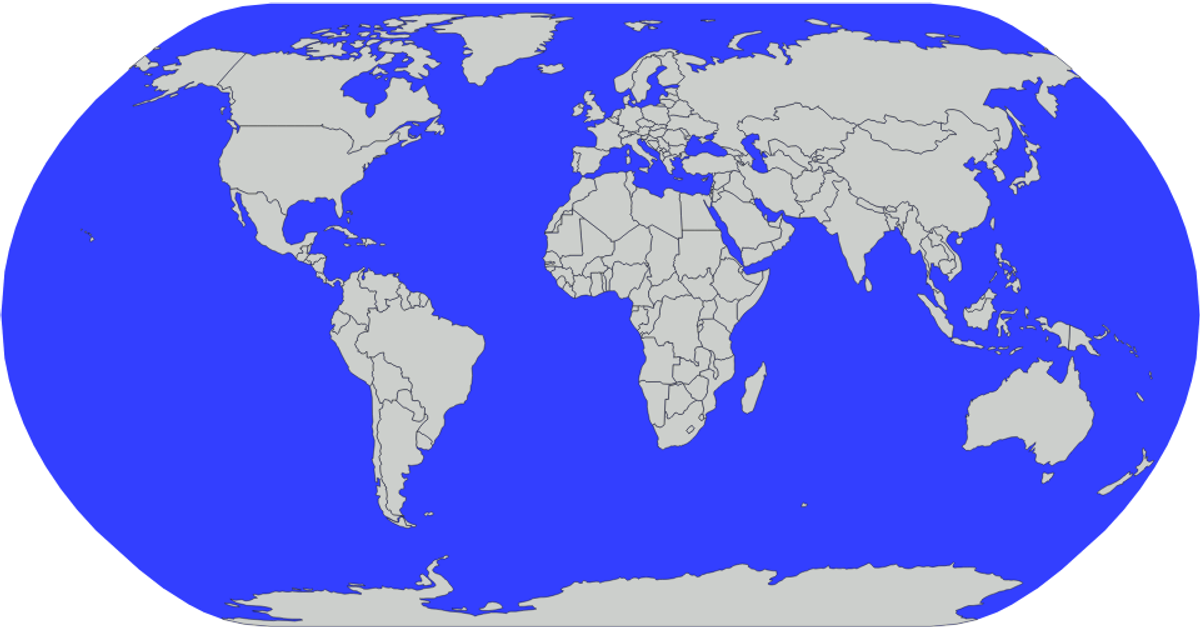
This example depicts a world map using the Natural Earth 1:110m dataset, with each country rendered as a filled purple polygon with black, semi-transparent strokes against a white sphere backdrop. It employs D3.js version 5’s `geoNaturalEarth1` projection and `geoPath` to generate SVG paths, while the TopoJSON library’s `feature` function extracts country geometries from the remote GeoJSON file. The visualization shows the sphere boundary and country borders as distinct SVG elements, loaded dynamically via a Promise.
AI-generated descriptionMIT Licensed




Comments
Sign in to join the discussion.