🌍 Public
Lokesh Question 2
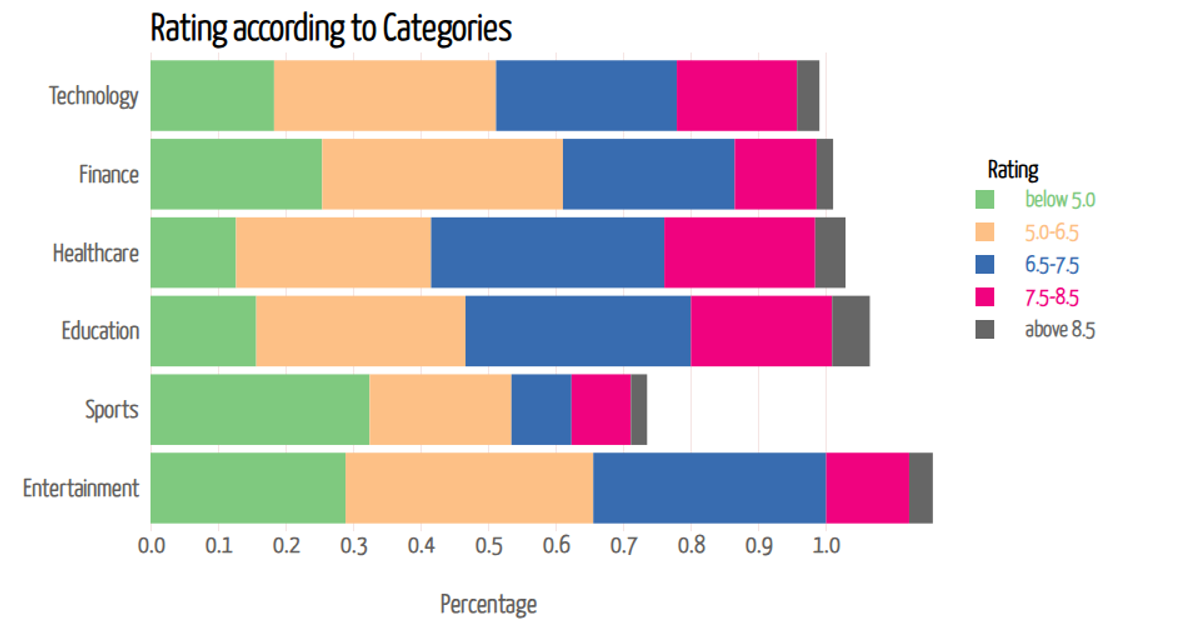
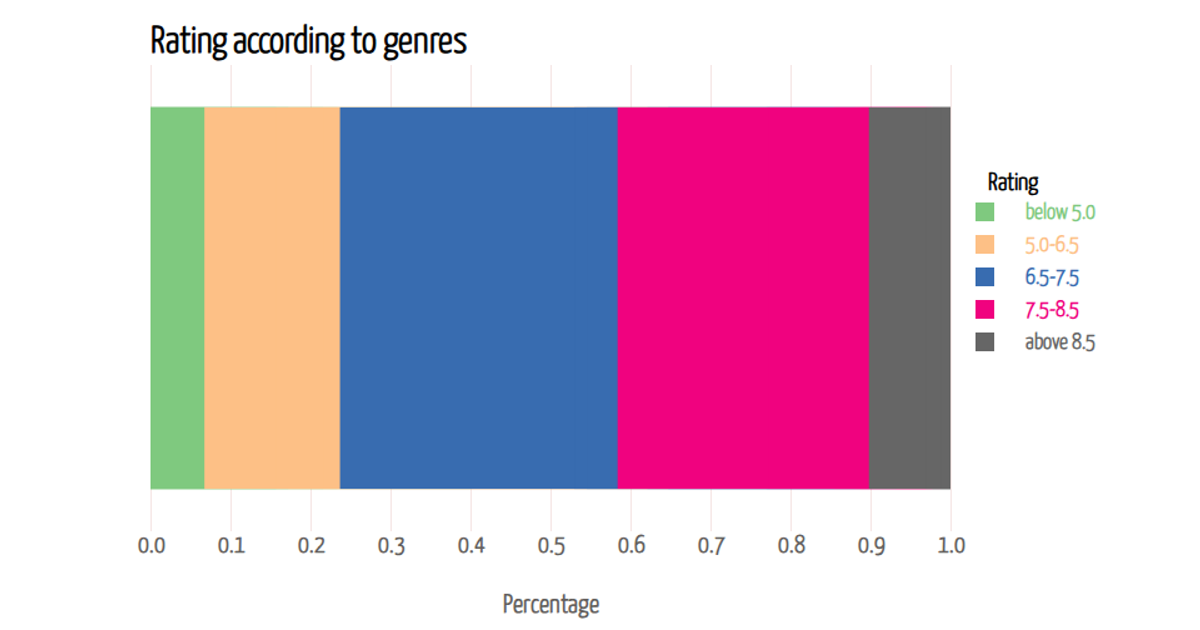
This example shows how iPhone 14 ratings vary across age groups, using a horizontal stacked bar chart where each bar represents an age cohort and segments show the proportion of ratings in five performance bands. The visualization uses D3 v7 to load comma-separated data, apply a d3.stack layout, and render SVG rectangles. A d3.scaleBand positions age groups along the vertical axis, while a d3.scaleLinear maps percentage values horizontally. Interactive tooltips appear on mouseover, displaying the exact percentage for each rating segment via formatted text.
AI-generated descriptionAge-Specific Ratings for iphone14
MIT Licensed




Comments
Sign in to join the discussion.