🌍 Public
US Cities Map At Night
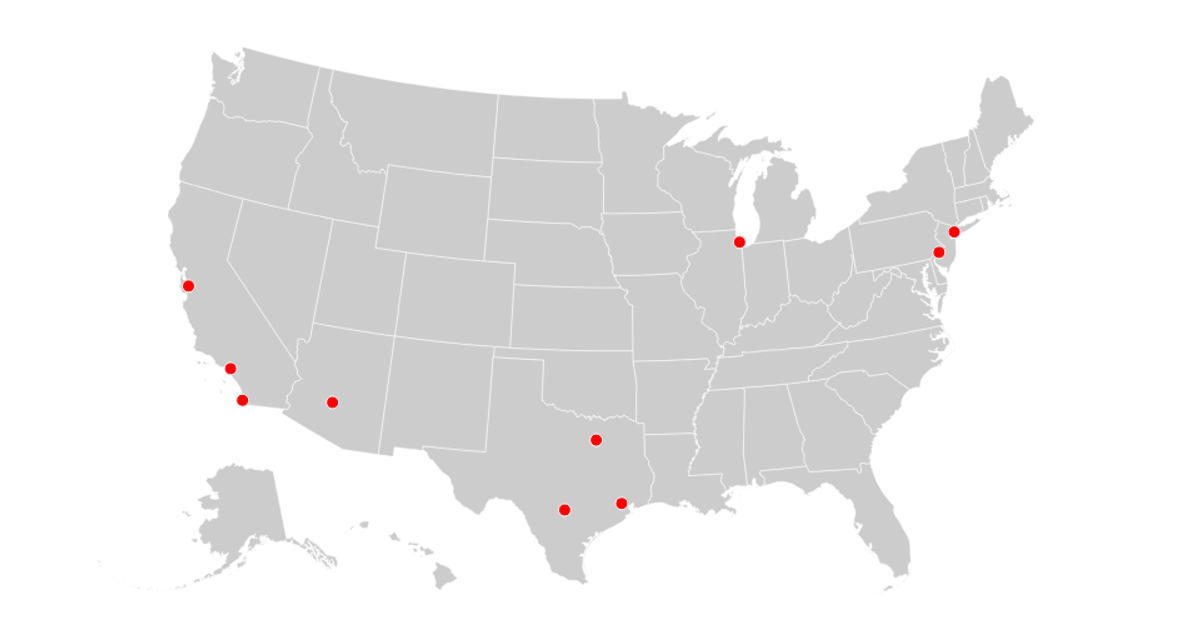
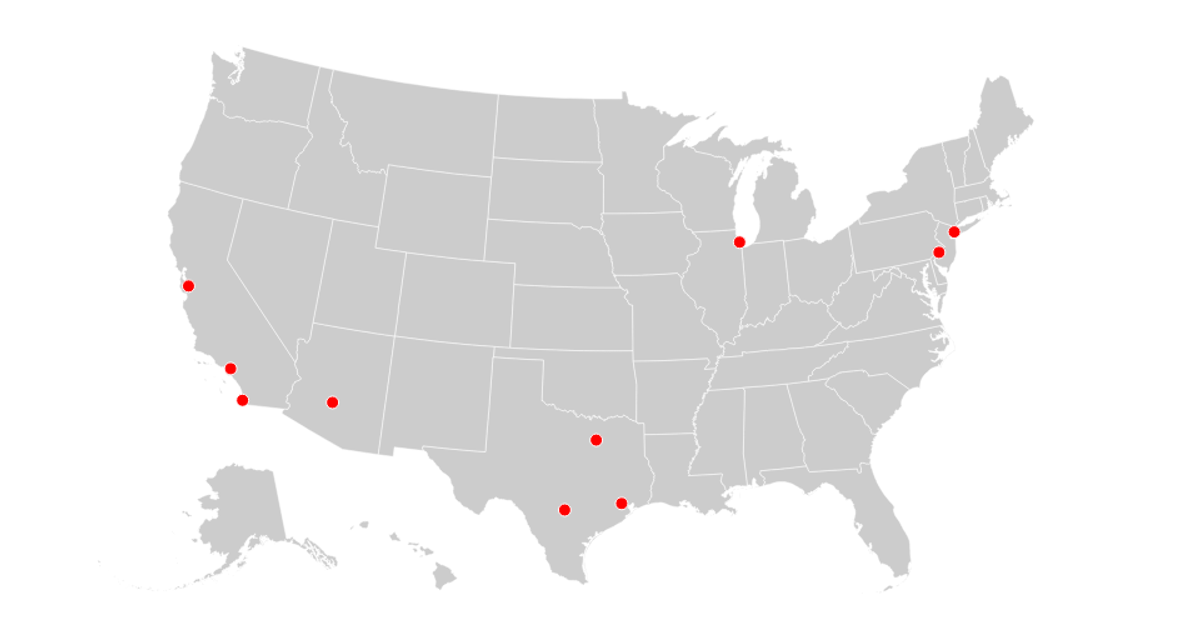
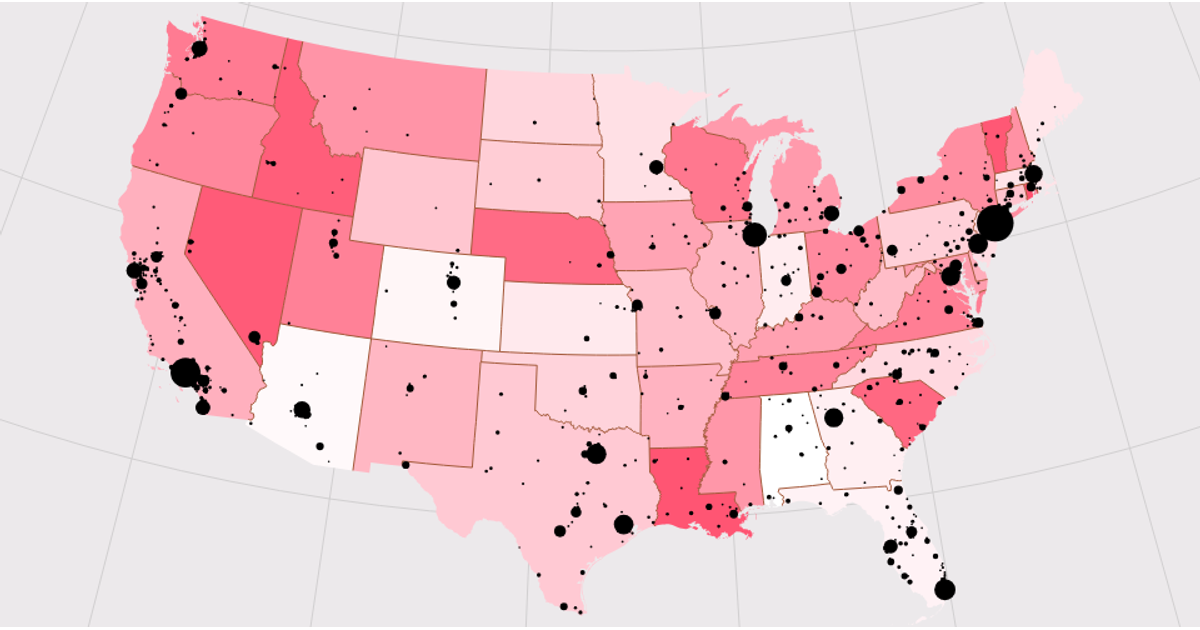
This example visualizes the geographic distribution of over 1,000 US cities as glowing dots on a dark, night-time map of the United States. The map renders state boundaries from US Atlas TopoJSON data using `d3.geoAlbersUsa` and `d3.geoPath`, while city coordinates are parsed from a CSV file with `d3.csvParse` and projected onto the map. Each city appears as a semi-transparent, pale yellow circle, with an overlaid graticule and outline providing spatial context. The visualization updates dynamically through a state-driven render loop, fetching both datasets asynchronously via the Fetch API.
AI-generated descriptionA map showing United States cities in a night view.
<img src="https://media.wired.com/photos/5a14853ab4c40a64e4c48665/191:100/w_1280,c_limit/dnb_united_states_1000.jpg" alt="USA at night" height="300px">See also:
- Simple Maps United States Cities Database
- Top 1000 US Cities
- Wikipedia: Toggle the table of contents Geographic coordinate system
- d3-geo: projection(point)
MIT Licensed





Comments
Sign in to join the discussion.