🌍 Public
Fork of Colm Lang A2 Heatmap
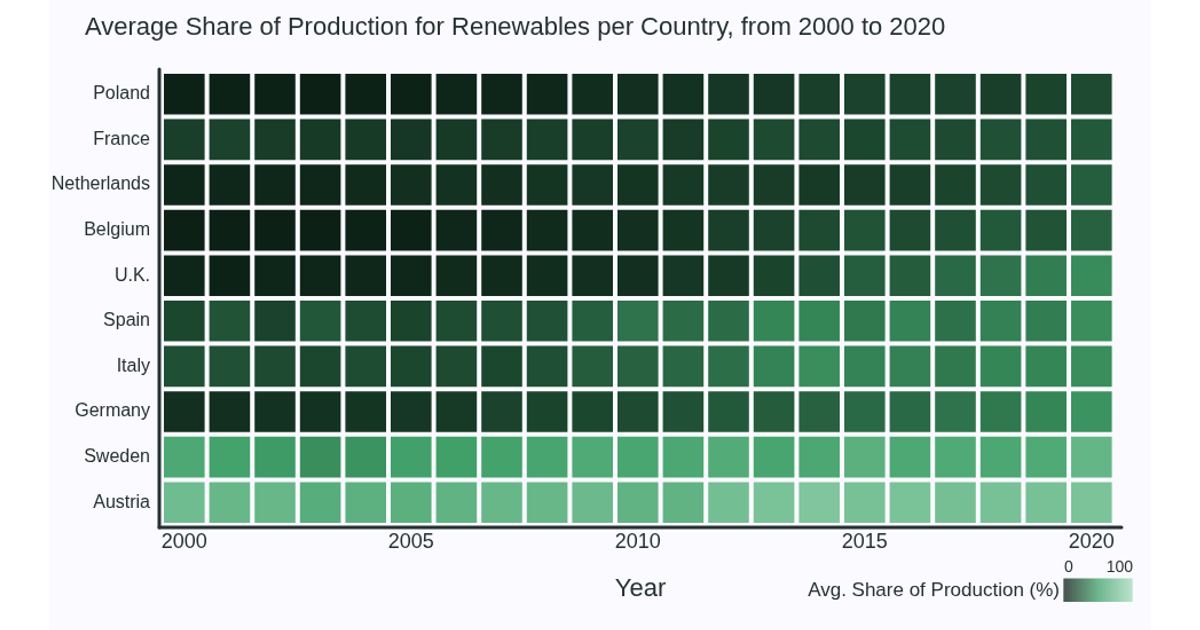
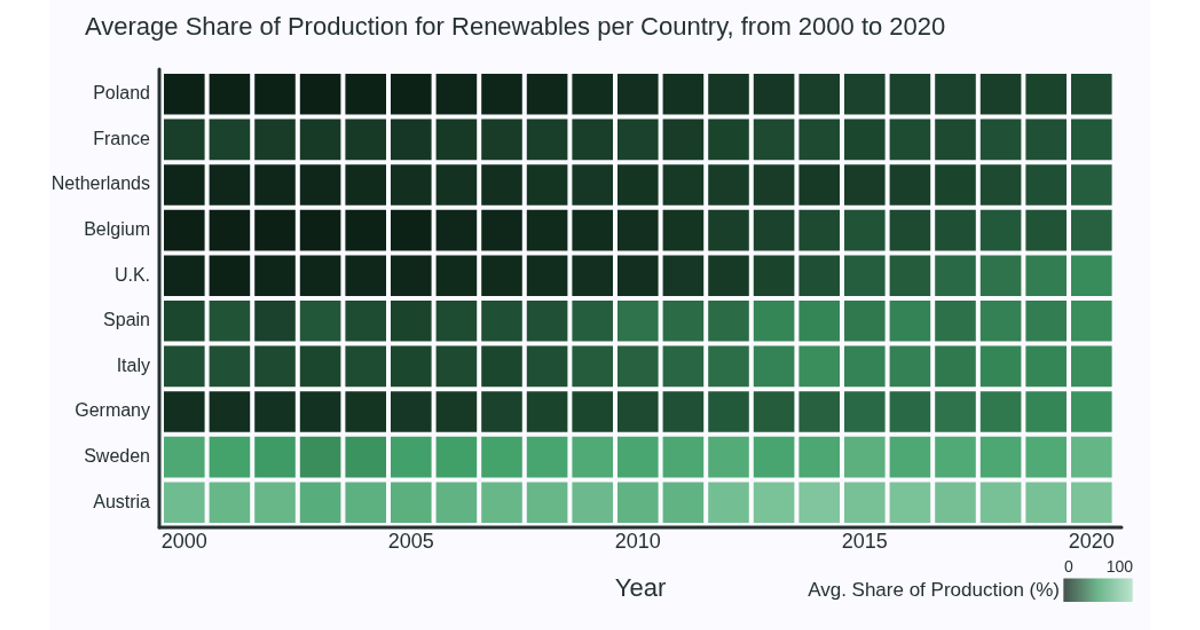
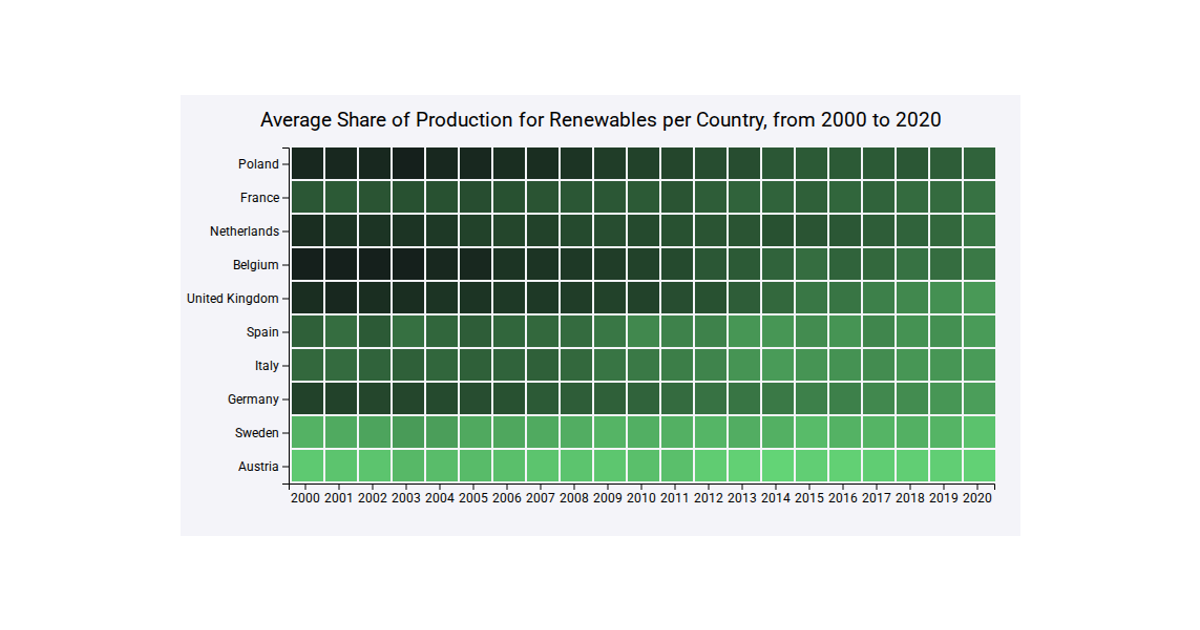
This heatmap shows the average share of renewable energy production for European countries from 2000 to 2020, with each row representing a country and each column a year, colored by percentage. The code uses p5.js to render the visualization, loading CSV data via `loadTable` from a GitHub Gist. It draws colored squares with `square`, maps values through the custom `getColor` function using `lerpColor`, and includes a gradient legend built from individual lines. Axes, titles, and country labels are placed with text and line drawing functions.
AI-generated descriptionMIT Licensed



Comments
Sign in to join the discussion.