🌍 Public
UbiPlotter test
This line chart visualizes tilt angle data from an IoT sensor, plotting the X-axis tilt angle over time. The data is embedded in the source as a JSON string, covering a 24-hour period from late January 2021. The chart uses D3 v6 to create a time-based x-axis and a linear y-axis, with a curve basis smoothing the line path. The visualization is rendered as an SVG, with axis labels and a title displayed via SVG text elements.
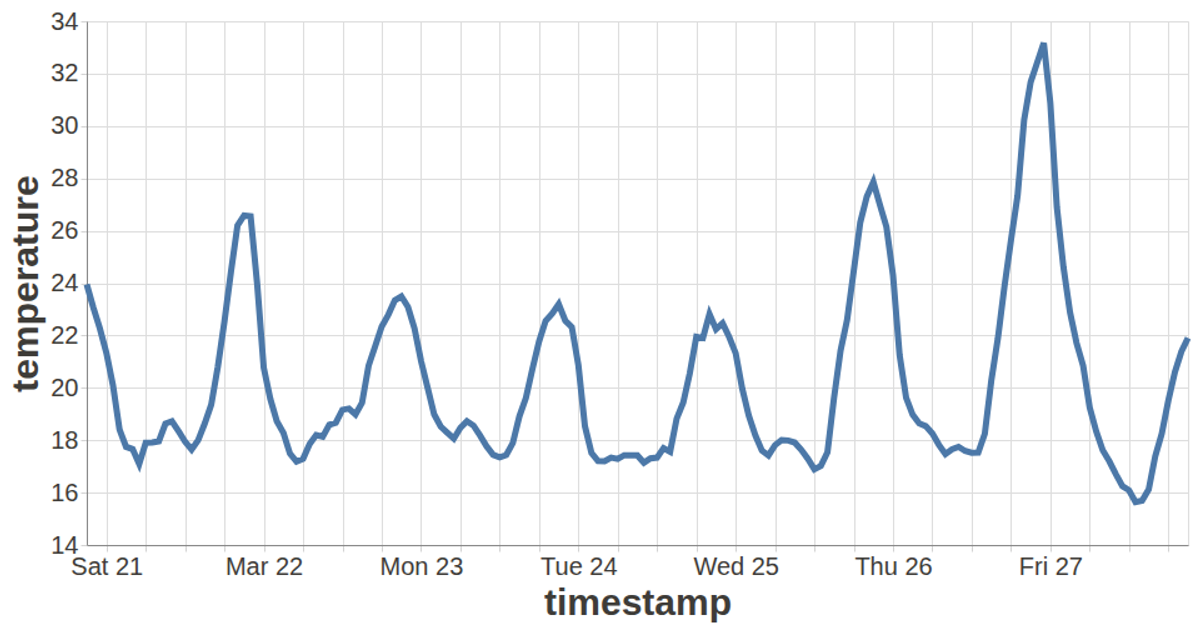
AI-generated descriptionThis line chart shows one week of temperature (in degrees Celcius) in San Francisco. The data comes from Data Canvas - Sense Your City.
MIT Licensed





Comments
Sign in to join the discussion.