🌍 Public
Tester
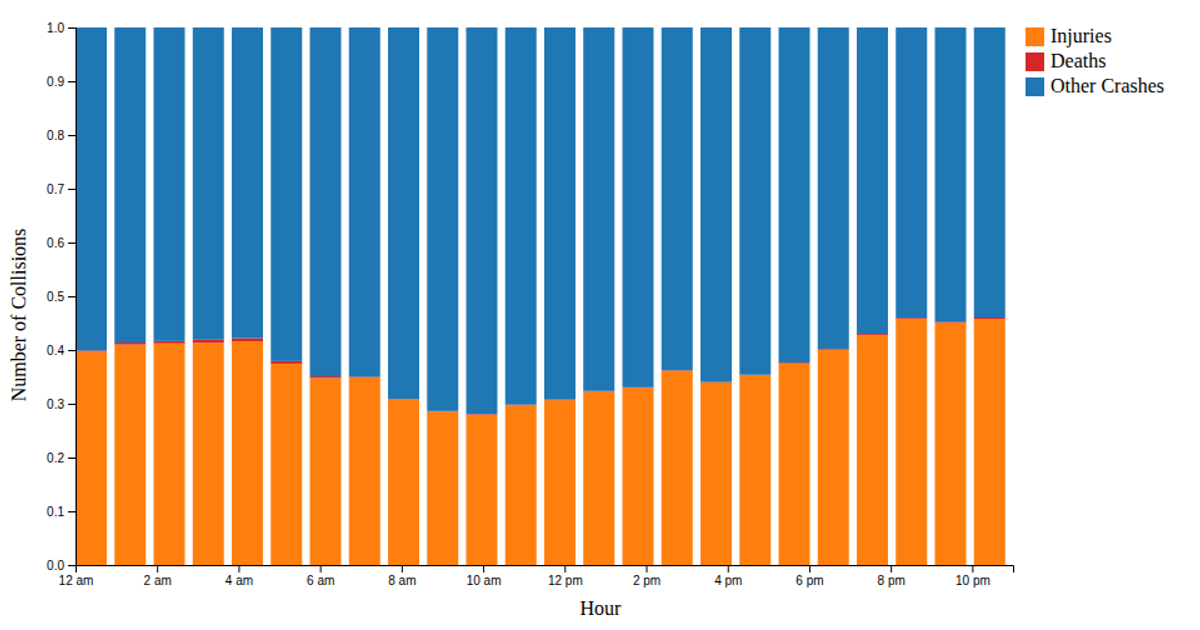
This visualization compares the number of traffic accidents that occurred in darkness versus daylight conditions using a simple bar chart. It filters a CSV file of Chicago traffic crash records into two categories based on lighting conditions, then renders the counts as animated steelblue bars. The chart is built with D3 v7, using `d3.scaleBand` and `d3.scaleLinear` for axes, and includes interactive tooltips on hover. The SVG rendering and bar transitions are handled entirely through D3’s standard data-join and selection methods.
AI-generated descriptionA bare minimum HTML page demonstrating use of CSS and JavaScript.
See also React Starter.
MIT Licensed



Comments
Sign in to join the discussion.