🌍 Public
grafico_Mapa
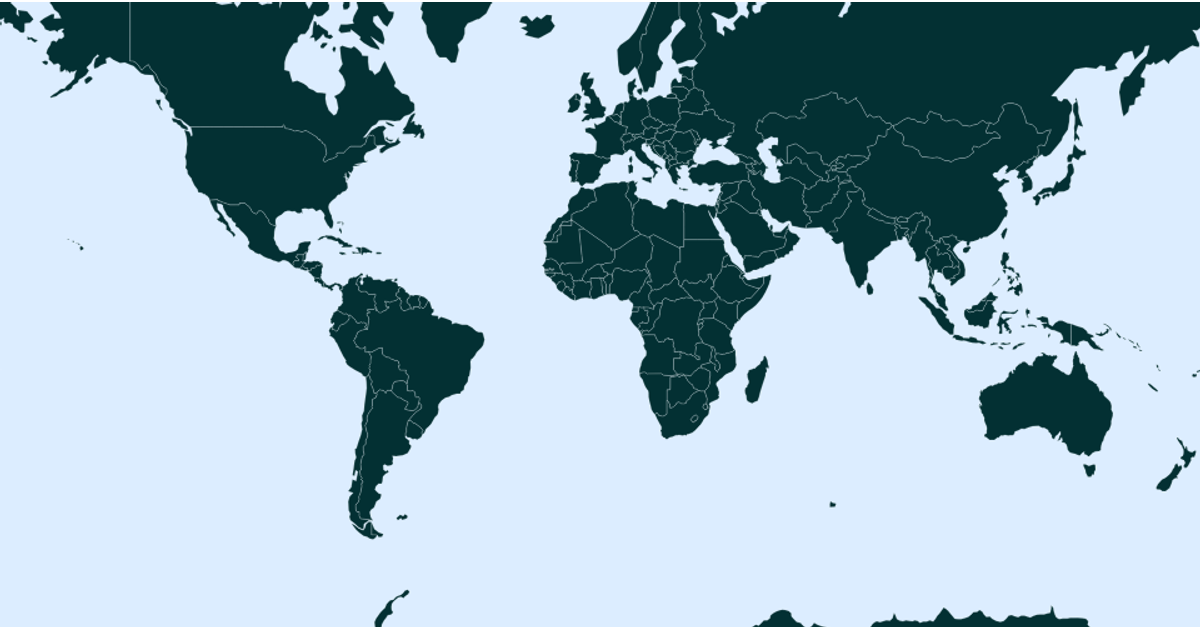
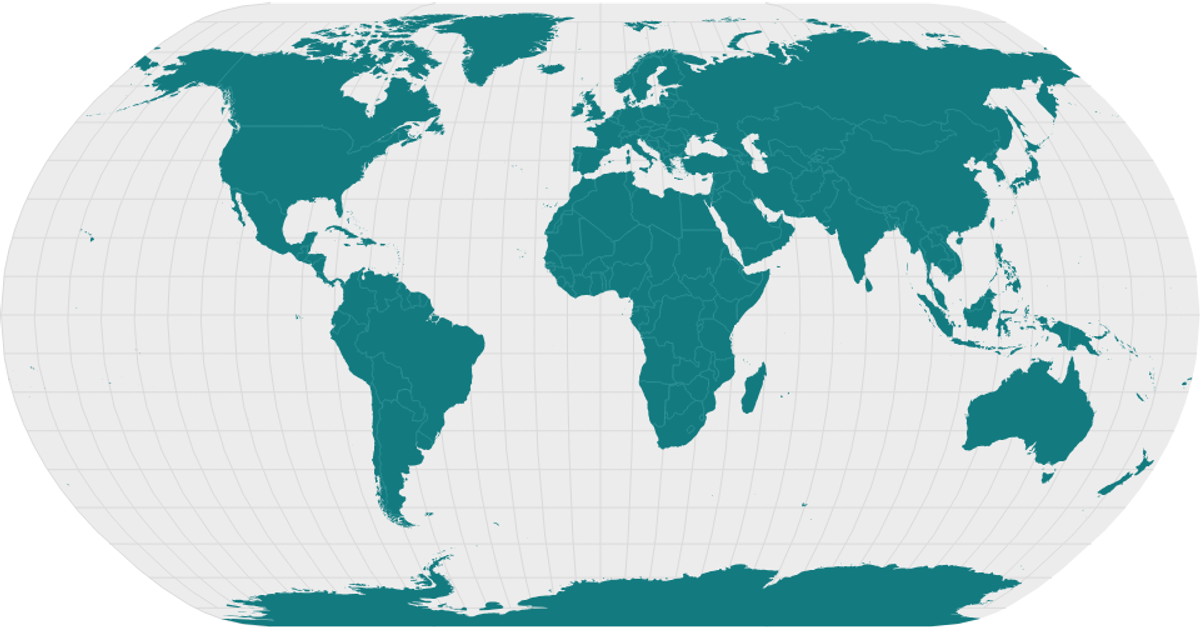
A choropleth map of world countries rendered as SVG paths, colored with teal strokes on a black background. The visualization uses the D3.js `geoPath` projection and `geoMercator` to transform geographic coordinates into screen coordinates, with country boundaries drawn from the World Atlas 110m GeoJSON dataset. The map fills the SVG canvas without axes or labels, showcasing the geometry of national borders. Topological features are loaded via `topojson.feature` from the `world-atlas` package, and the resulting map emphasizes the global distribution of landmasses.
AI-generated descriptionMIT Licensed



Comments
Sign in to join the discussion.