🌍 Public
CS599 - Project 6
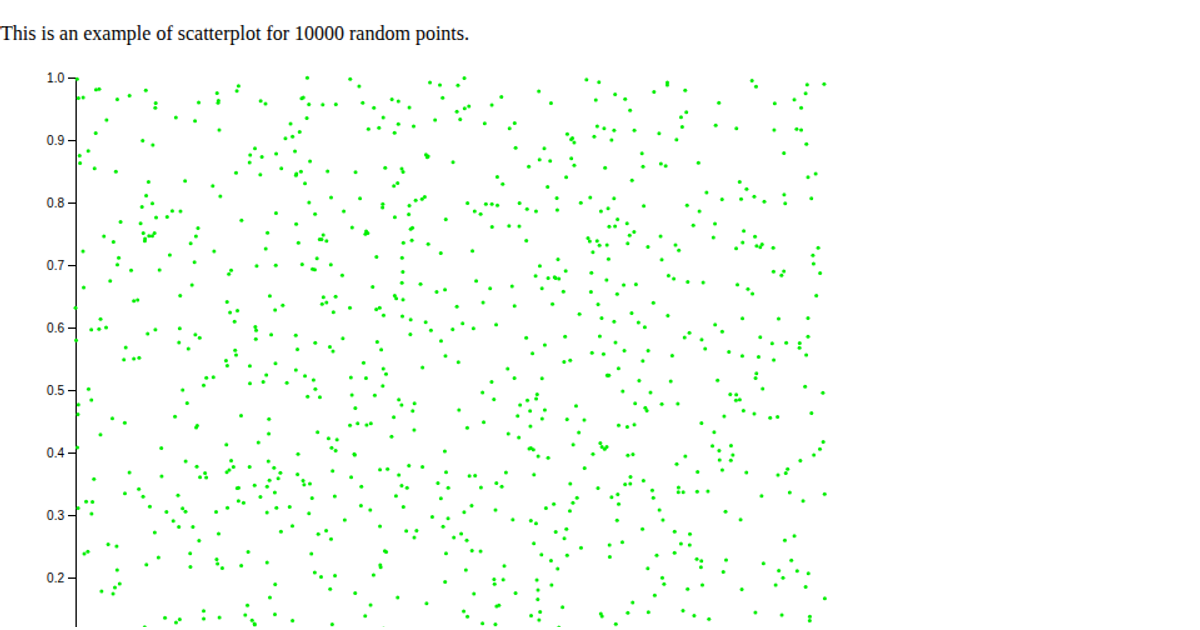
This example visualizes the distribution of outcomes from a Monte Carlo betting simulation, showing the end result of a $100 starting stake across multiple trials. Users adjust sliders for parameters like number of trials, simulations, bet percentage, win multiplier, blowup chance, and kernel bandwidth, with the chart updating in real time. The visualization combines a density estimate curve, drawn using d3.line with a kernelEpanechnikov estimator and d3.scaleLinear axes, with overlaid scatter circles representing individual simulation results. The code uses D3 v6 to manipulate SVG elements directly.
AI-generated descriptionMIT Licensed





Comments
Sign in to join the discussion.