🌍 Public
idjejc
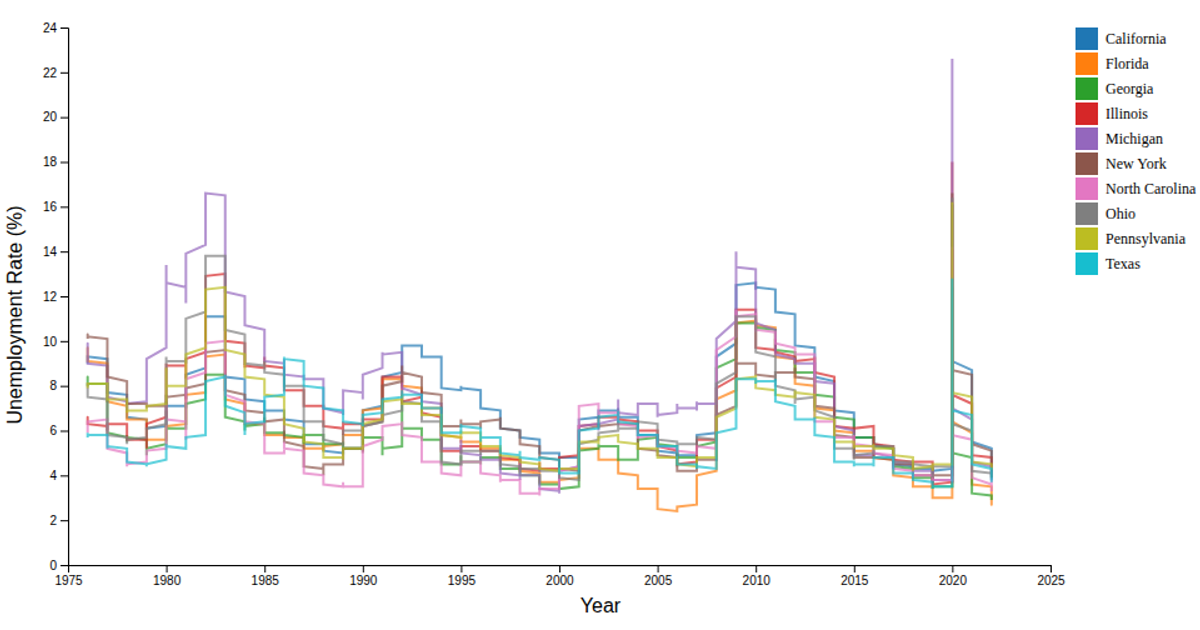
This example shows how labor force participation and unemployment rates for South Dakota, California, and Florida change over time. It uses six colored lines—one for each state’s participation or unemployment rate—plotted against years on a linear scale. The visualization is built with D3 v7, loading data from a CSV file and rendering as SVG. It employs `d3.scaleOrdinal` for colors, `d3.line` for path generation, and `d3.axisBottom` and `d3.axisLeft` for the axes, with a legend and title added manually.
AI-generated descriptionA responsive scatter plot.
MIT Licensed



Comments
Sign in to join the discussion.