🌍 Public
nonaga
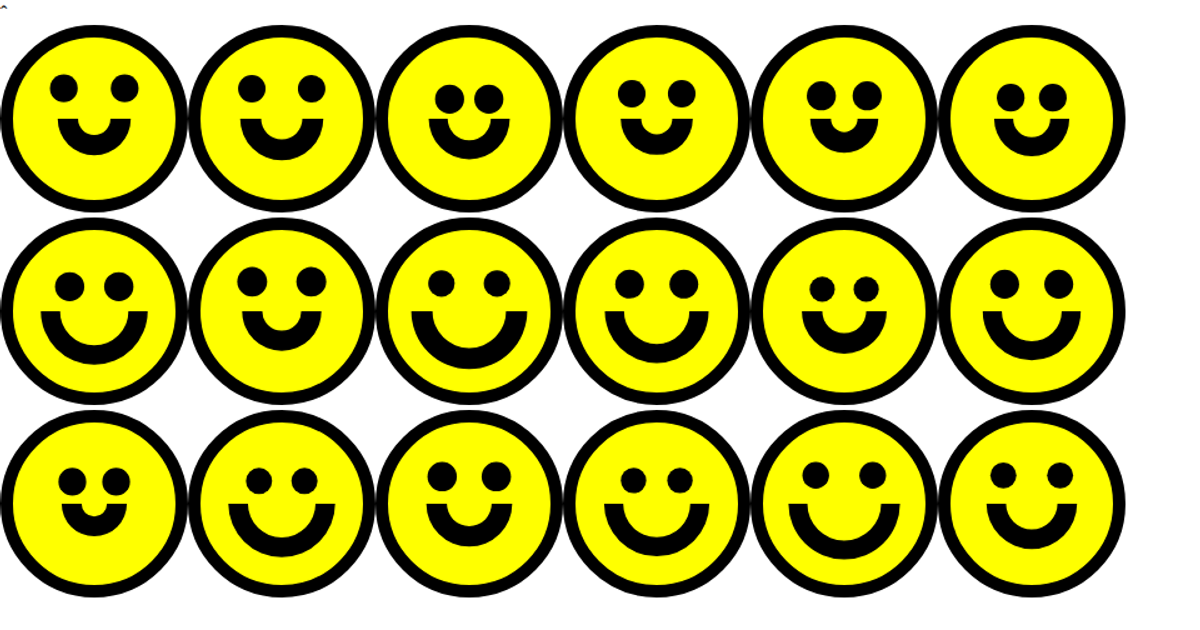
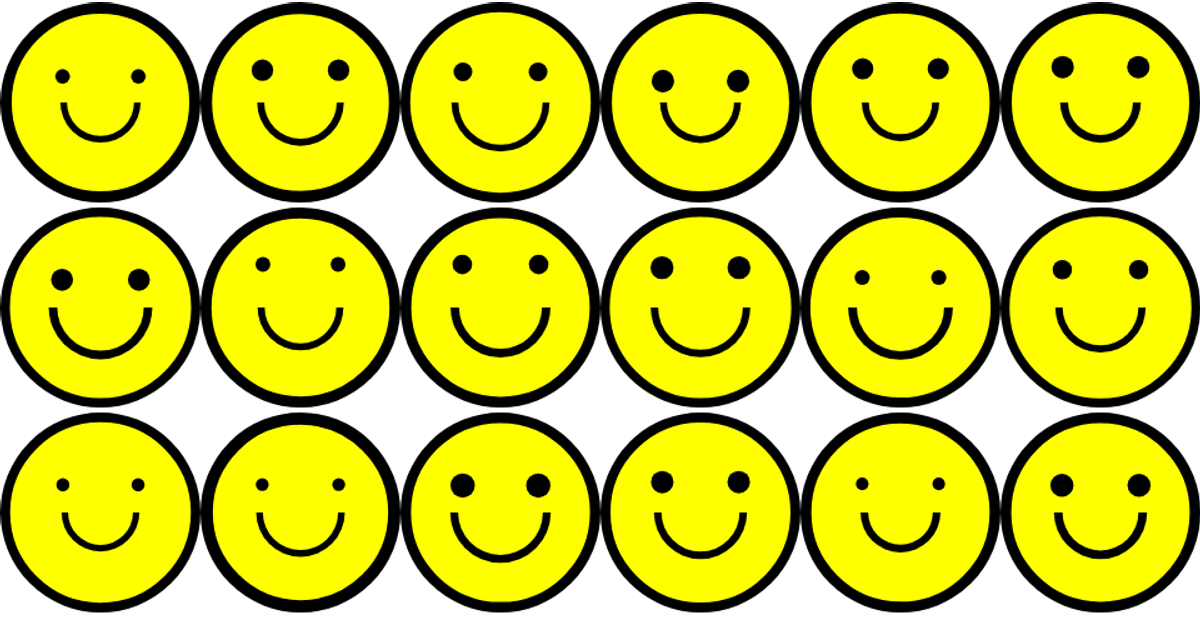
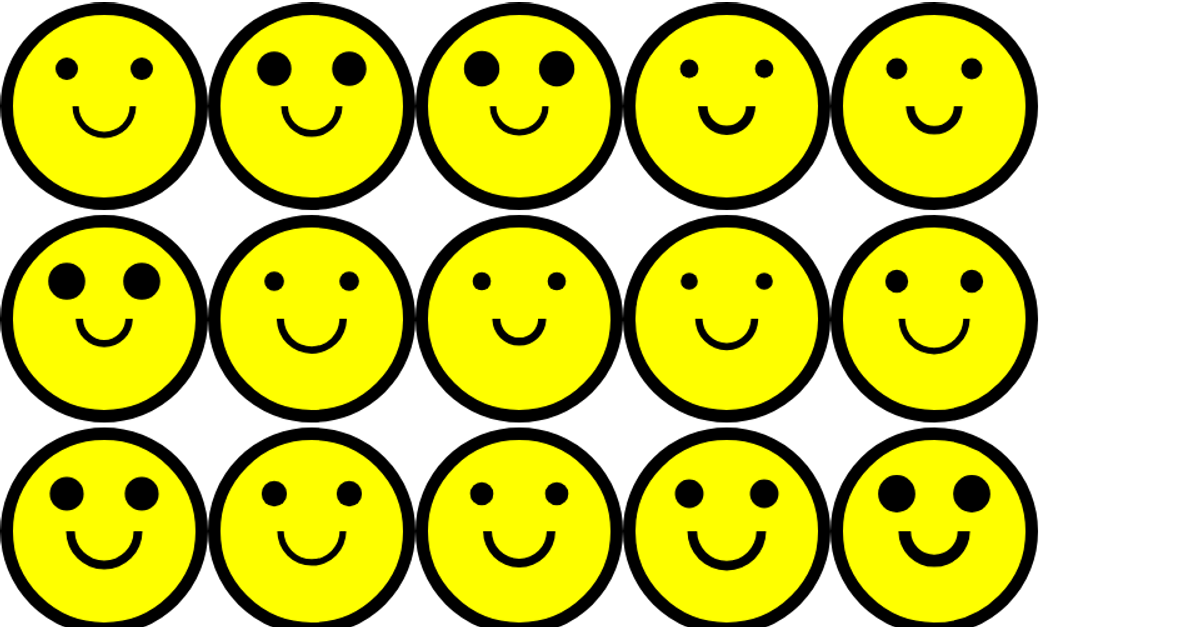
A single static face is rendered repeatedly twenty times, with each iteration randomly assigning a color, eye radius, mouth radius, and mouth width. The data visualization shows a grid of varied cartoon-like faces, emphasizing random parameter variation to create visual diversity. Built with React and D3 v7, the code uses D3's `arc` generator in `Mouth.js` to draw the mouth path, while React components structure the face elements (background circle, eyes, mouth) as SVG. The rendering approach is SVG output, with color choices pulled from a hardcoded array of ten distinct colors.
AI-generated descriptionEl comienzo de una carita HTML page.
MIT Licensed


Comments
Sign in to join the discussion.