🌍 Public
Color and Size Legends
Zzlastefcia
Last edited Sep 25, 2020
Created on Sep 25, 2020
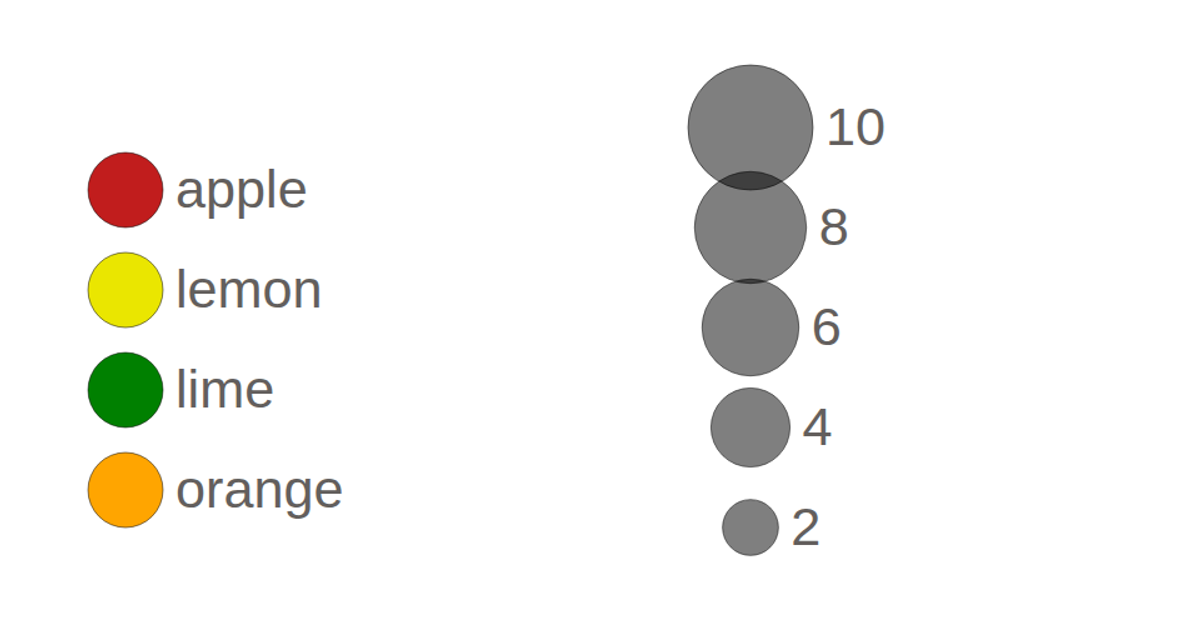
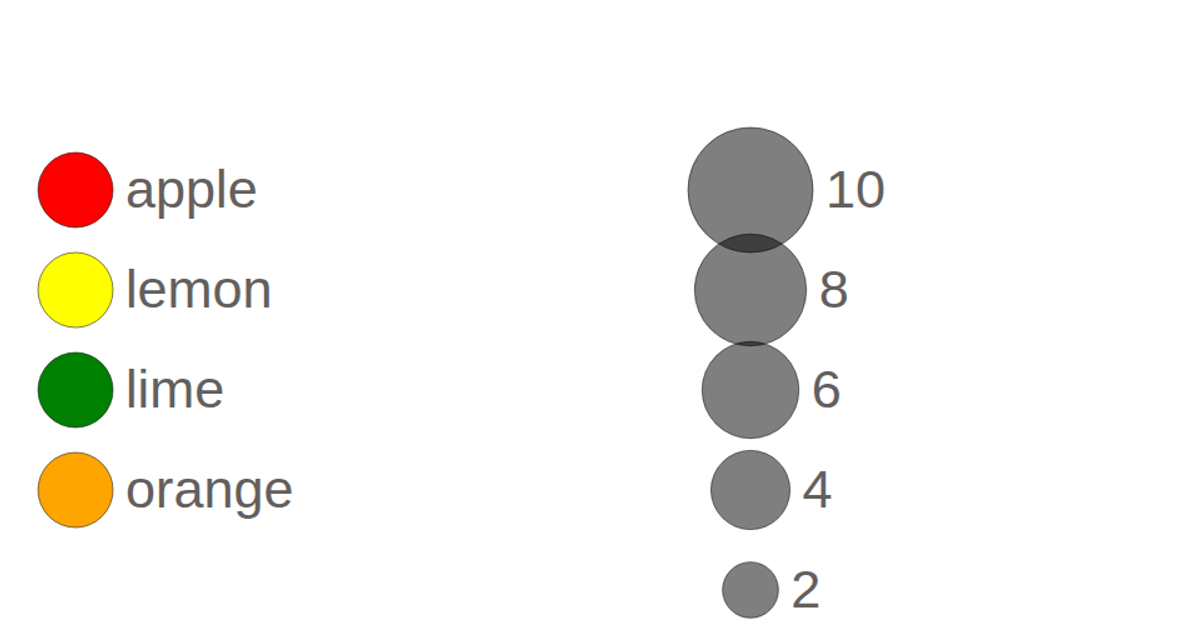
This example demonstrates two SVG legends for mapping data to visual channels. The color legend uses a `scaleOrdinal` with domain categories and a range of colors, while the size legend uses `scaleSqrt` with five ticks to show proportional circle radii. Both legends are implemented as reusable functions, `colorLegend` and `sizeLegend`, which bind data to groups and update circles and text elements. The code uses D3 v5 selections, `enter`/`merge`/`exit` patterns, and SVG attributes like `r`, `fill`, and `transform` for layout.
AI-generated descriptionMIT Licensed


Comments
Sign in to join the discussion.