🌍 Public
Mercator Panning & Zooming
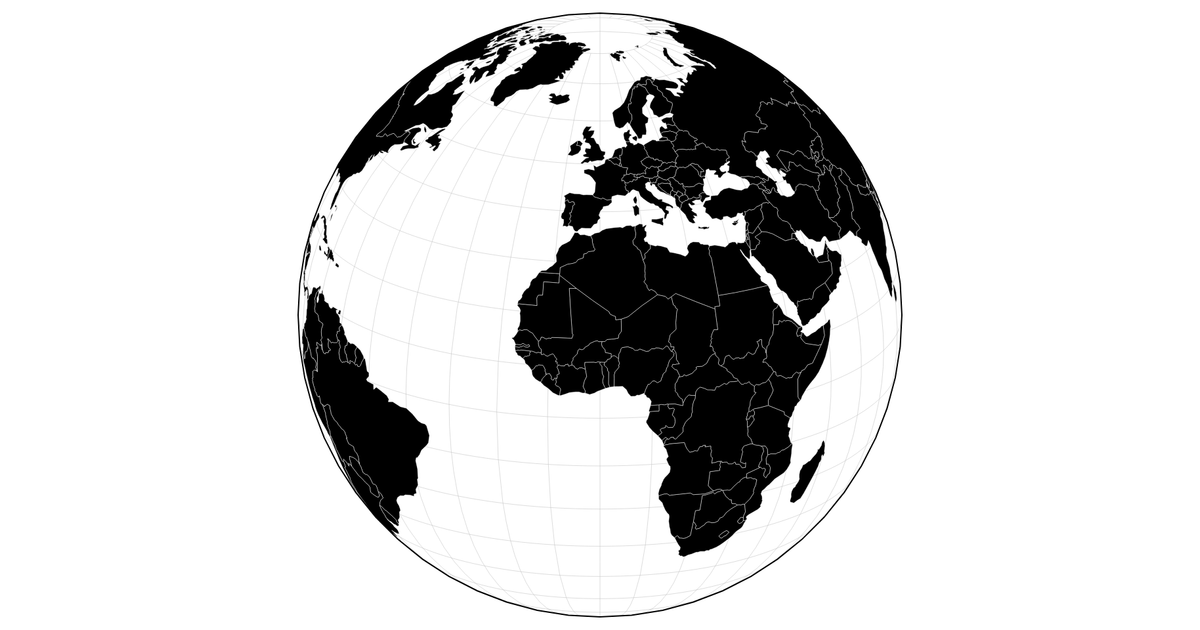
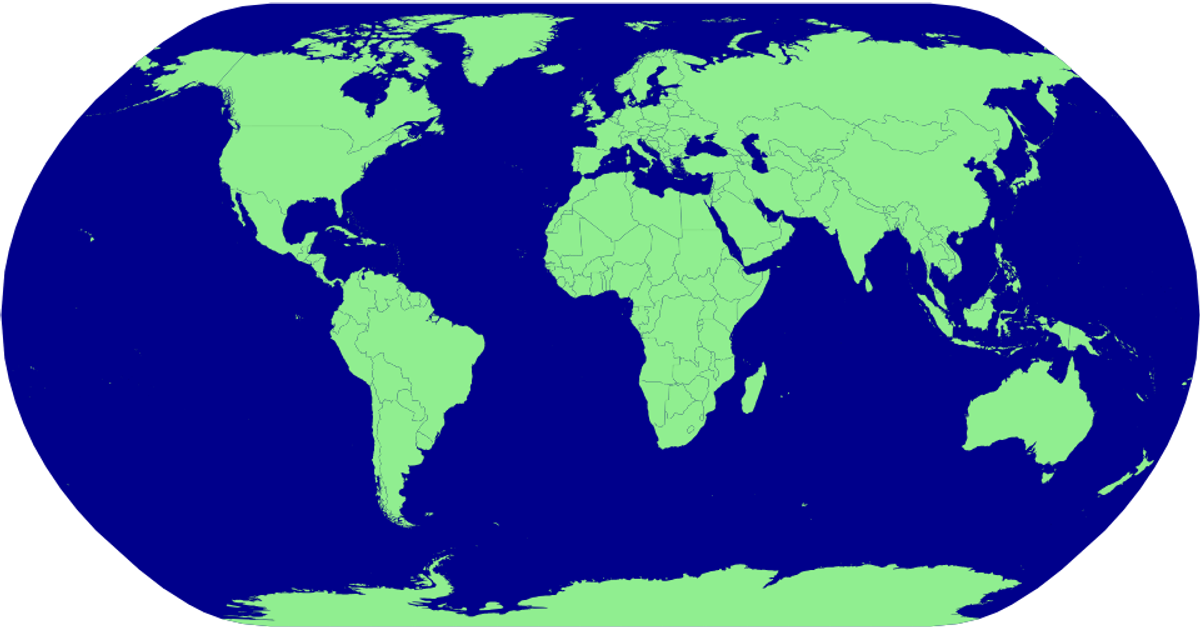
This example demonstrates a Mercator projection map of the world that supports interactive panning and zooming. The visualization renders country boundaries as vector paths and includes a graticule grid, with an outline representing the sphere. The interaction is managed through the `d3.zoom` API, which adjusts the projection's scale and translation. Map data is fetched from the *visionscarto* world atlas, and the rendering pipeline uses `d3.geoPath` and `d3.geoGraticule`, with the `topojson-client` library processing the topology data into geographic features.
AI-generated descriptionInspired by Observable: Zoomable Raster & Vector
MIT Licensed



Comments
Sign in to join the discussion.