🌍 Public
experiment with functions
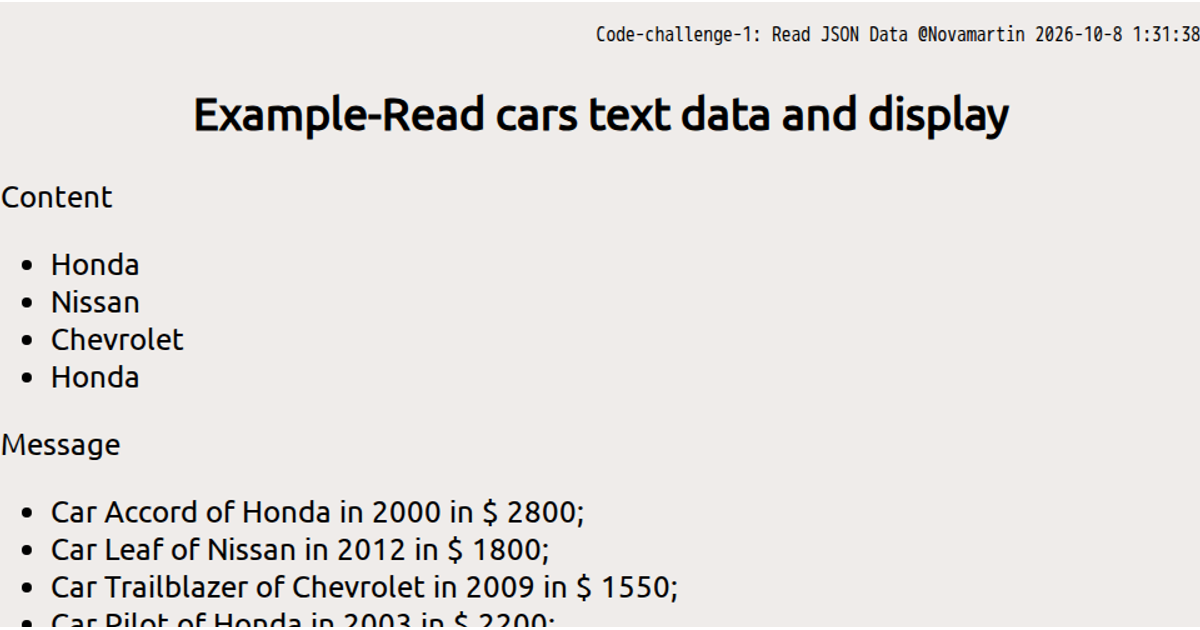
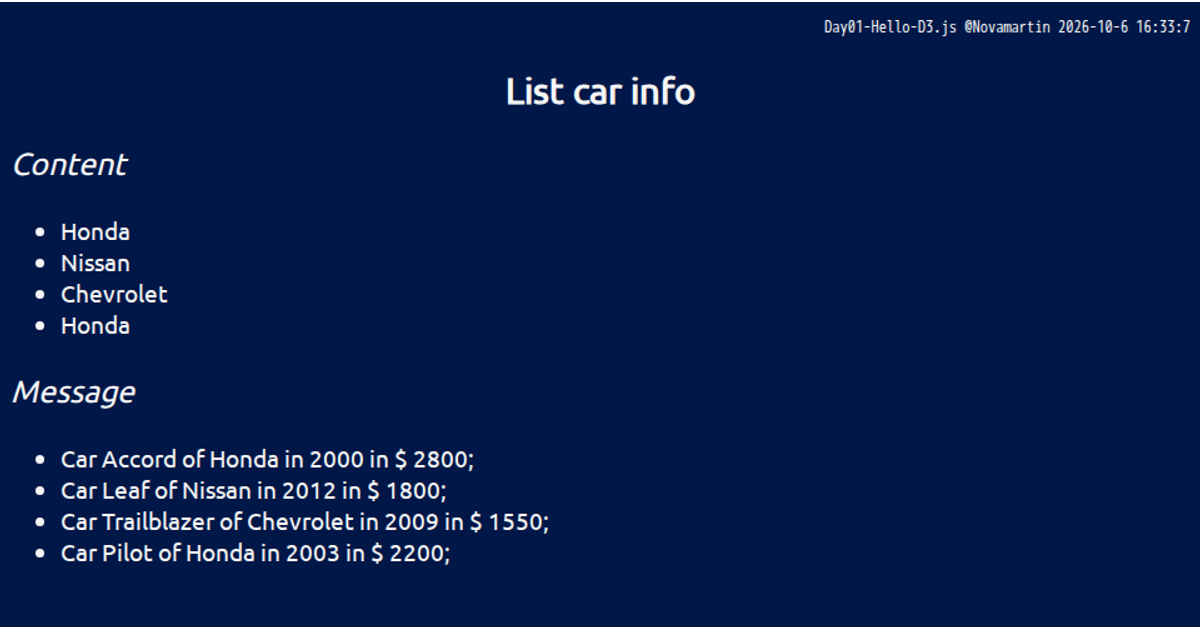
This example demonstrates a D3.js experiment with functions using JavaScript arrays and data transformation methods. It features an in-code JSON dataset of fictional cars with properties like make, model, year, and price, and also includes a separate CSV file with country population figures. The visualization uses D3 v6's `scaleLinear`, `scaleBand`, `max`, and `csv` APIs to log and process data, though the rendering logic is largely commented out. The code explores various programming constructs—including while and for loops—to iterate through the car data and print price values to the console.
AI-generated descriptionMIT Licensed






Comments
Sign in to join the discussion.