🌍 Public
Fork of D3 Scatter Plot
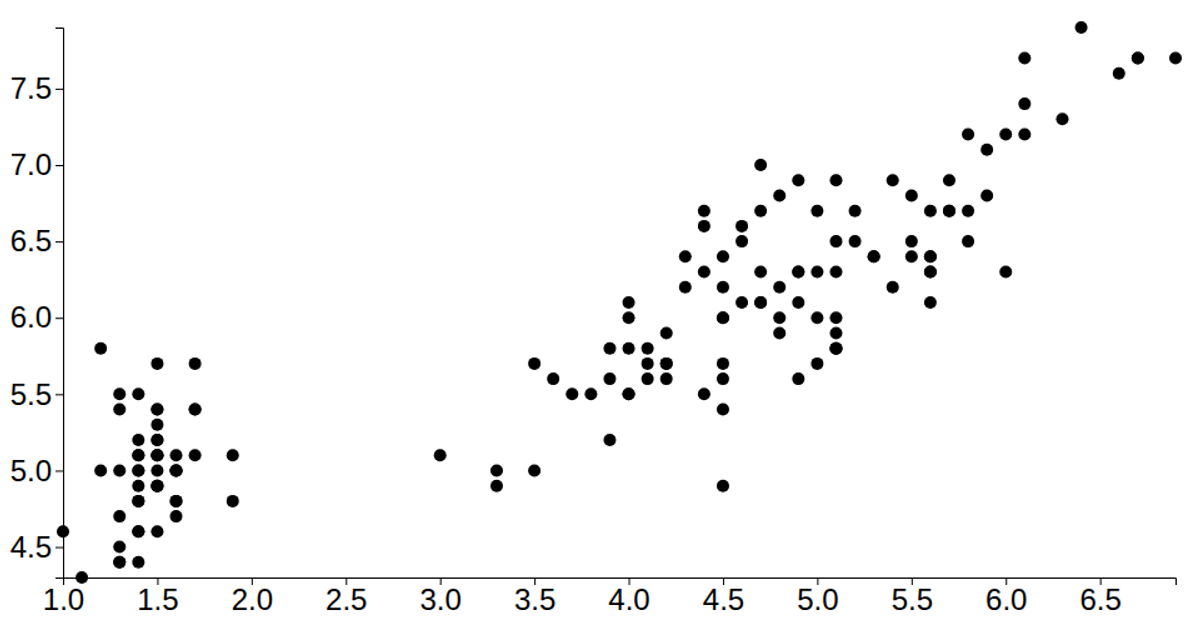
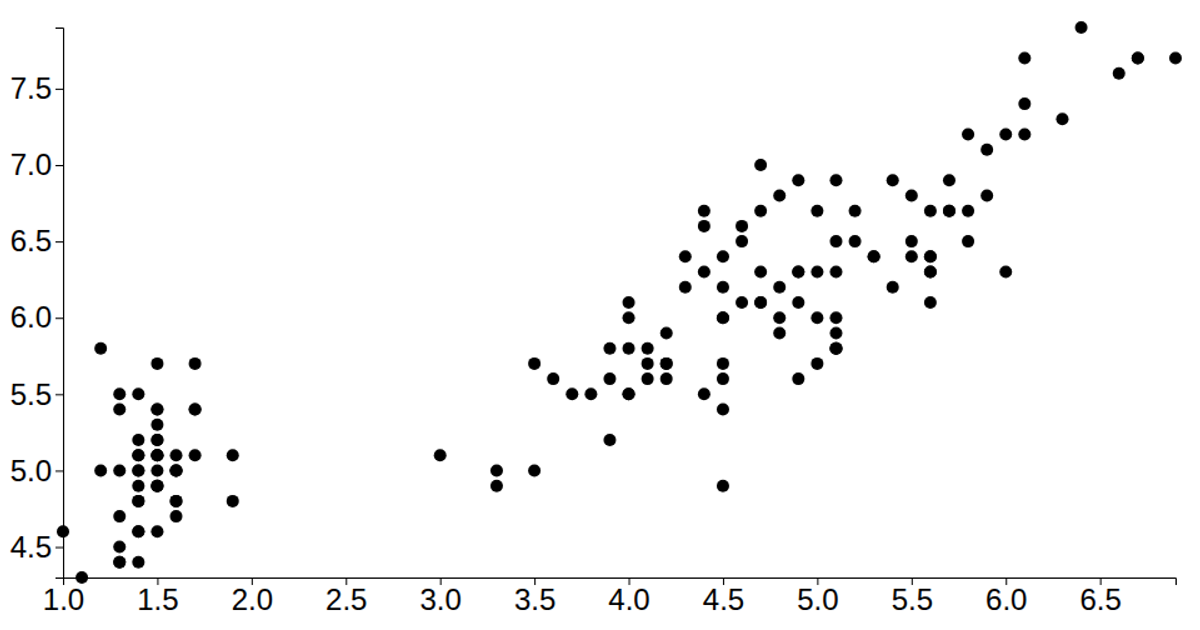
This visualization displays the classic Iris dataset, plotting petal length against sepal length as individual circles on a scatter plot. The code loads CSV data from a GitHub Gist using D3’s `csv` method with a row-parsing function, then applies `scaleLinear` scales with `extent` to map data values to screen coordinates. Axes are rendered using `axisLeft` and `axisBottom`, while circles are bound to the SVG via `selectAll` and `join`. The chart fills the browser window and is built entirely with D3 v6, rendering as SVG.
AI-generated descriptionA vanilla HTML implementation of a D3 scatter plot. Shows the Iris Dataset.
MIT Licensed


Comments
Sign in to join the discussion.