🌍 Public
Hungary and its neighbours
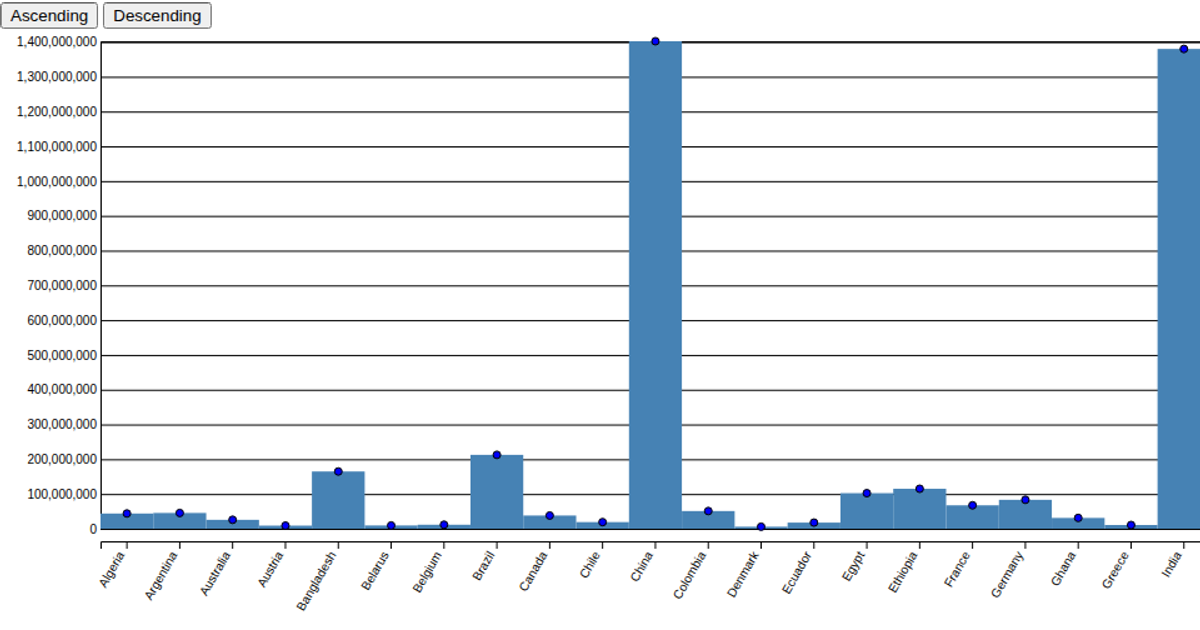
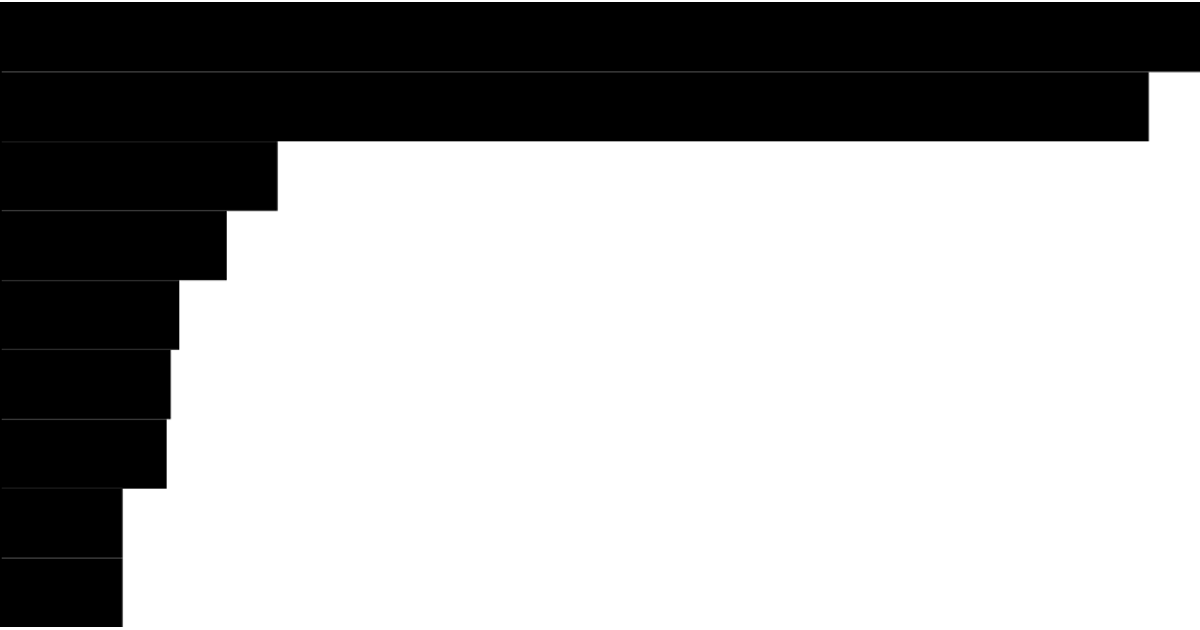
This chart uses a bar chart to compare the populations of Hungary and its six neighboring countries, with data loaded from a CSV file and displayed as animated bars that grow horizontally. The visualization employs D3.js v5 with linear and band scales for axes, utilizing `scaleLinear`, `scaleBand`, `axisBottom`, and `axisLeft`, while a `transition().duration(2420)` animates the bar widths. The SVG rendering includes gridlines, a population axis label, and cursive font styling, with numbers formatted as compact notation.
AI-generated descriptionMIT Licensed





Comments
Sign in to join the discussion.